Figures & data
Figure 1. The chemical structure of chitosan (a) and epichlorohydrin (b).
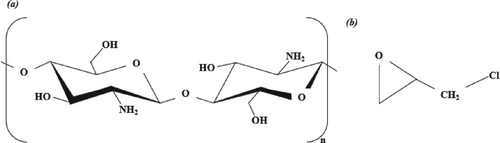
Figure 2. Scheme of the research plan.
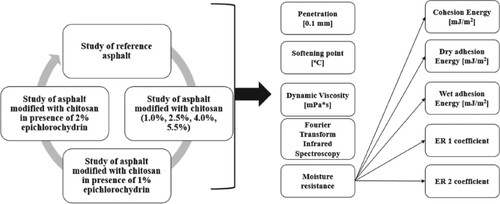
Table 1. Labelling of samples studied in the work.
Figure 3. Effect of chitosan and epichlorohydrin content [%] on the penetration of modified bitumen.
![Figure 3. Effect of chitosan and epichlorohydrin content [%] on the penetration of modified bitumen.](/cms/asset/e3f70ef3-fd0f-4a82-903b-ac72bd1e5733/trmp_a_2174357_f0003_ob.jpg)
Figure 4. The chitosan cross-linking scheme with epichlorohydrin.
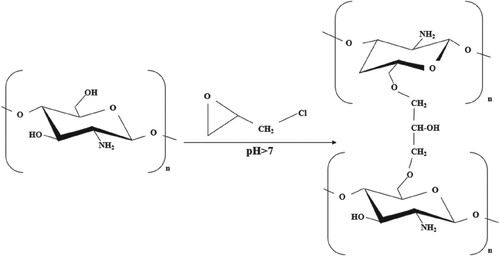
Figure 5. Effect of chitosan and epichlorohydrin content [%] on softening point of the modified bitumen.
![Figure 5. Effect of chitosan and epichlorohydrin content [%] on softening point of the modified bitumen.](/cms/asset/47227d83-3c10-472d-ab1f-317f058f3016/trmp_a_2174357_f0005_ob.jpg)
Figure 6. Effect of chitosan and epichlorohydrin addition on penetration index of the modified bitumen.
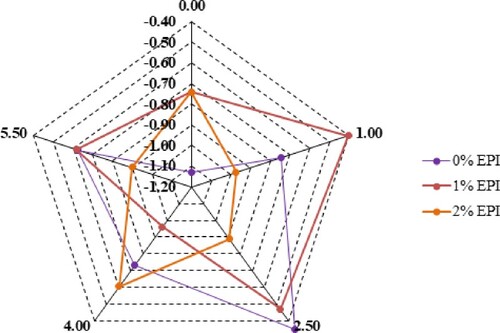
Figure 7. Effect of chitosan and epichlorohydrin addition on dynamic viscosity of the modified bitumen binder at 135°C.
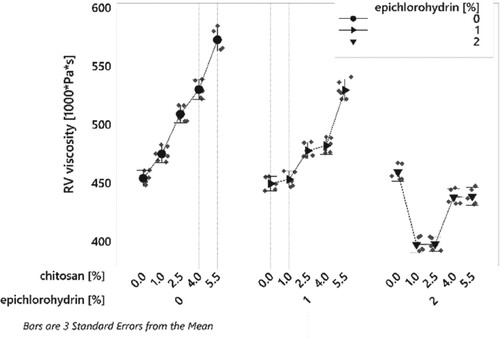
Figure 8. FTIR spectra of bitumen modified with different chitosan contents with the use of 0% (a), 1%(b) and 2%(c) of epichlorohydrin.
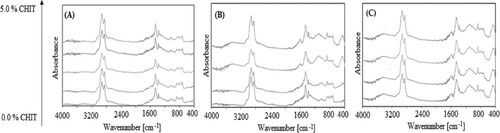
Figure 9. Cohesion energy of modified binders.
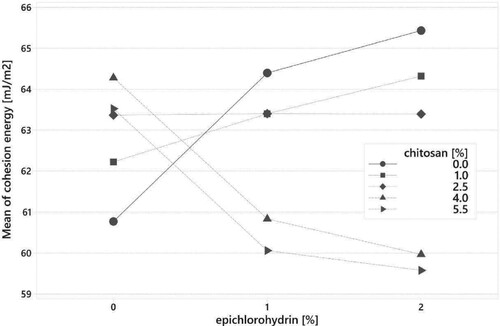
Table 2. Analysis of variance for cohesion energy.
Table 3. Analysis of variance for dry and wet adhesion energy.
Table 4. Analysis of variance for ER1 and ER2.
Figure 10. Dry adhesion (a) and wet adhesion (b) energy results for the tested binders.
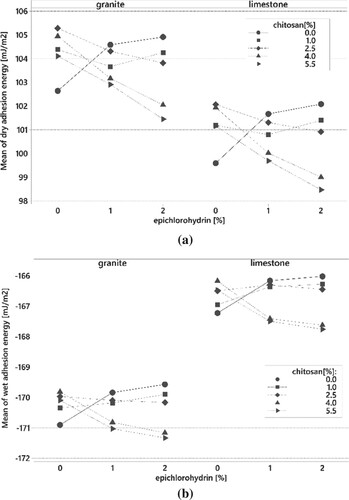
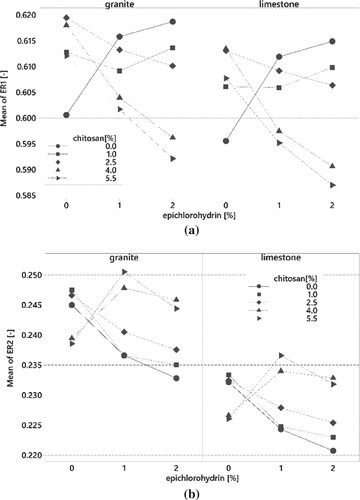
Figure 11. ER1 (a) and ER2 (b) results for the tested binders.