Figures & data
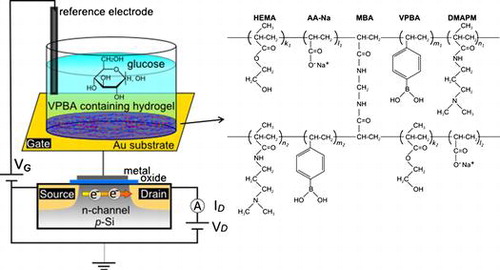
Figure 1. Schematic illustration of copolymerized hydrogel-based FET for glucose recognition. The FET was composed of an extended-gate FET with an Au substrate. A thin layer of hydrogel with a structural formula of poly(HEMA-ran-DMAPM-ran-VPBA-ran-AA) was copolymerized on the Au surface, where it interacted with glucose. HEMA and DMAPM were used as the main-chain monomers, AA was used to improve absorbability and VPBA was used as the glucose recognition component.
Figure 2. Photograph of hydrogels copolymerized with different mixing ratios of the solid content and VPBA contents. The solid content of the monomers was changed from 10 to 30 wt%, as shown in the vertical direction, and the VPBA content was changed from 0 to 3 wt%, as shown in the horizontal direction.
Figure 3. Swelling ratios of hydrogels copolymerized with different mixing ratios of the solid content and VPBA contents. The hydrogels were immersed in the buffer solution with or without glucose. The dotted line indicates the swelling ratio after equilibration with water, and the solid line indicates the swelling ratio after equilibration with 100 mM glucose. (Triangles: 10 wt% solid content, circles: 15 wt% solid content, squares: 30 wt% solid content).
Figure 4. Shifts in gate voltage in hydrogel FETs with different mixing ratios of the solid content and VPBA contents upon a change in the concentration of glucose. (Squares: 10 wt% solid content, circles: 15 wt% solid content, triangles: 30 wt% solid content; Red, blue, and green show VPBA concentrations of 0.5, 1.5, and 3.0 wt%, respectively.)
Figure 5. Real-time changes in surface potential of 15/0.5 hydrogel FET upon the addition of glucose in the range of 10 μM to 40 mM at room temperature. At the arrows, each sample solution was introduced onto the 15/0.5 hydrogel FET. The blue line shows the signal obtained with the control sensor, in which PBS buffer solutions without glucose were added, while the red line shows the signal obtained with the 15/0.5 hydrogel FET, in which PBS buffer solutions with glucose were added.
Figure 6. Changes in the surface potential of 15/0.5 hydrogel FET with logarithm of glucose concentration based on the signals shown in Figure 5. The linear fit corresponds to R2 = 0.995.
Figure 7. Real-time monitoring of surface potential with hydrogel FETs with different hydrogel thicknesses. (Black: unmodified Au gate, blue: hydrogel-modified Au gate copolymerized by 20 μl monomer solution, red: hydrogel-modified Au gate copolymerized by 200 μl monomer solution.)
Scheme 1 Equilibrium between vinylphenylboronic acid and a diol compound.