Figures & data
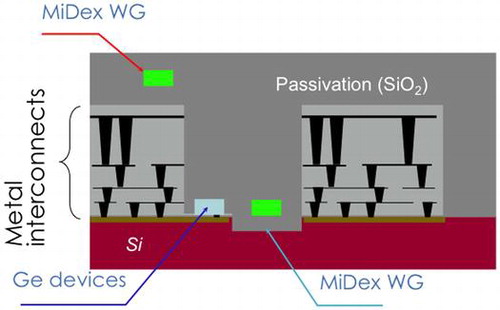
Figure 1. Information capacity vs. year. Signal multiplexing technologies, such as wavelength division multiplexing (WDM) and electrical time division multiplexing (ETDM), assume the most vital role to meet the considerable growth of communication capacity. Reproduced with permission from The Electrochemical Society Interface, 9–2, 20, (2000).
Figure 2. Local heating of central processing unit (CPU). This figure is from [Citation9], which is in black and white. Thanks to Y. Vlasov for the color version.[Citation10]
![Figure 2. Local heating of central processing unit (CPU). This figure is from [Citation9], which is in black and white. Thanks to Y. Vlasov for the color version.[Citation10]](/cms/asset/d9a7c5ab-8395-4fc5-b9f8-30b49be3fd2b/tsta_a_1301193_f0002_oc.gif)
Figure 3. Minimum channel spacing. Thermal shift and crosstalk should determine the minimum channel spacing.
Table 1. The relation of minimum channel spacing with Q factor at 1550 NM.
Figure 4. Materials chart for Si photonics platform. MiDex and HiDex are shown. Horizontal axis shows the optical index difference, Δn = ncore – nclad at 1.55 μm, where the cladding is SiO2. (a) Design figure for minimum bending radius and scattering loss with experimental results shown by squares. (b) Design figure for thermo-optic coefficient and bandgap of materials group. Symbols show literature data. Calculation of minimum bending radius is regarding that bending loss less than 0.1 dB/turn as acceptable.
Figure 5. Typical SEM images of fabricated SiNx. (a) A cross sectional SEM image, (b) a plan view image of SiNx ring and coupled waveguides used in the present work.
Figure 6. Transmission characteristics of PVD- and CVD- SiNx waveguides on SiO2. (a) Transmission spectra. The PVD-SiNx waveguide is shown in red, the CVD-SiNx is plotted in black and in blue (annealed at 900 °Cfor 3 h). The transmission loss of the CVD-SiNx after 1150 °Cannealing for 3 h (not shown here) is identical to that of the PVD-SiNx (red). (b) The transmission loss of the PVD-SiNx waveguide. The loss ~5.6 dB cm–1 is obtained using the waveguide with air upper cladding. Simulation indicates that the loss is reduced to ~1 dB cm–1 with the SiO2 upper cladding.
Figure 7. Transmission characteristics of the PVD- and CVD-SiNx ring resonators at temperatures from room temperature (24 °C) to 76 °C. (a) The spectra of the drop port show Q of 31,600. (b) The resonance peak shifts of CVD-SiNx rings are reproduced by the reported thermo-optic coefficient, 2.4 × 10⁻⁵ 1/K, obtained for CVD stoichiometric Si3N4.[Citation15] The shifts are slightly larger for PVD than CVD rings. The thermo-optic coefficient of the PVD-SiNx is 2.8 × 10⁻⁵ 1/K.
![Figure 7. Transmission characteristics of the PVD- and CVD-SiNx ring resonators at temperatures from room temperature (24 °C) to 76 °C. (a) The spectra of the drop port show Q of 31,600. (b) The resonance peak shifts of CVD-SiNx rings are reproduced by the reported thermo-optic coefficient, 2.4 × 10⁻⁵ 1/K, obtained for CVD stoichiometric Si3N4.[Citation15] The shifts are slightly larger for PVD than CVD rings. The thermo-optic coefficient of the PVD-SiNx is 2.8 × 10⁻⁵ 1/K.](/cms/asset/8598fd1b-3831-46de-9966-88ecbcc03c0d/tsta_a_1301193_f0007_oc.gif)
Figure 8. The peak wavelength shift of the PVD-SiNx ring resonators with athermalization using a ‘silicone’ polymer as the upper cladding (red). The shifts were measured between 24 and 70 °C. The black and red lines are simulations. An athermalized SiNx (MiDex) ring shows a smaller thermal shift than reported for an athermalized Si rings (black).[Citation36] The athermalized SiNx ring covers S-, L- and U-bands within the 50 GHz channel spacing at this temperature range, while the reported, athermalized Si rings cover C band.
![Figure 8. The peak wavelength shift of the PVD-SiNx ring resonators with athermalization using a ‘silicone’ polymer as the upper cladding (red). The shifts were measured between 24 and 70 °C. The black and red lines are simulations. An athermalized SiNx (MiDex) ring shows a smaller thermal shift than reported for an athermalized Si rings (black).[Citation36] The athermalized SiNx ring covers S-, L- and U-bands within the 50 GHz channel spacing at this temperature range, while the reported, athermalized Si rings cover C band.](/cms/asset/8d0ef1ba-9cdd-4a86-8c97-6191c599fc87/tsta_a_1301193_f0008_oc.gif)
Figure 9. Design figure of thermo optic coefficient (blue circles) and bandgap (red squares) vs. Δn. The PVD-SiNx and CVD-SiNx are within the green circle of Si3N4. The following four materials, (1) Al2O3, (4) HfO2, (7) Ta2O5 and (12) Ga2O3, should be excellent candidates because of their low TO coefficients < 10−5 1/K and the wide bandgaps >4 eV.
Table 2. The MiDex materials characteristics.
Figure 10. Schematics of a monolithic electronic and photonic integrated circuits on a Si bulk wafer (cross section). WG stands for waveguide.