Figures & data
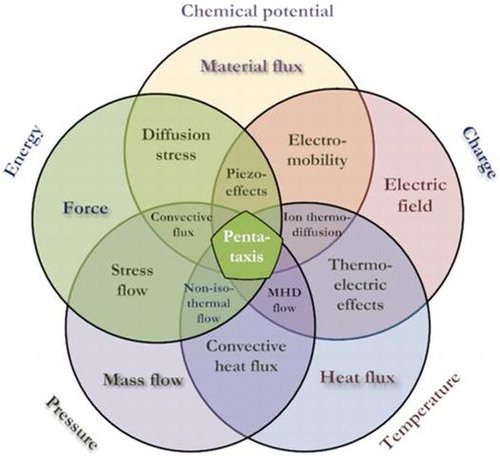
Figure 1. Principal connections and interactions between the physical stimuli and materials parameters. Numbers in brackets indicate respective tensor rank.
Figure 2. The philosophy of pentataxis concept (MHD, magnetohydrodynamics).
Table 1. Fundamental stimuli and pentataxis forces with the respective phenomena (simplified).
Table 2. Comparison of periodontal (= adjacent to natural tooth) and peri-implant (= adjacent to implant biomaterial) soft tissues and their attachment (adapted from [Citation72,75]).
Figure 3. Timeline for healing of an implant and readout areas for 7 and 14 days in vitro, adapted from [Citation72].
![Figure 3. Timeline for healing of an implant and readout areas for 7 and 14 days in vitro, adapted from [Citation72].](/cms/asset/f9b81a83-f26a-45e6-8e0e-21ba62a70e8a/tsta_a_1348872_f0003_oc.gif)
Figure 4. The concept of the biomaterials enhanced simulation testing [Citation80–82].
![Figure 4. The concept of the biomaterials enhanced simulation testing [Citation80–82].](/cms/asset/e165457f-2244-45c8-82ef-75f78775da65/tsta_a_1348872_f0004_oc.gif)
Figure 5. The dental abutment test concept (based on [Citation72]) for the BEST platform (DO, dissolved oxygen; DAQ, data acquisition; POST, post-processing data treatment; pCO2, CO2 partial pressure; MCDA, multi-criteria decision aiding).
![Figure 5. The dental abutment test concept (based on [Citation72]) for the BEST platform (DO, dissolved oxygen; DAQ, data acquisition; POST, post-processing data treatment; pCO2, CO2 partial pressure; MCDA, multi-criteria decision aiding).](/cms/asset/626c555f-51fd-4b68-817a-ac63f5263191/tsta_a_1348872_f0005_oc.gif)
Figure 6. An example of mucosal tissue-abutment interface quality measurement with BEST (Figure ), expressed as modulus under: a) pseudo-static loading part (‘creeping’); and b) dynamic loading (1 Hz, 30 μm deformation amplitude).