
Figures & data
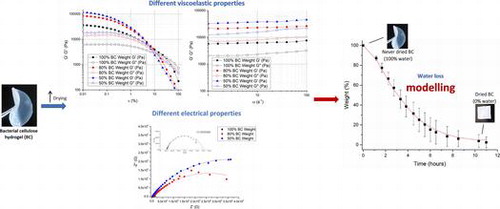
Figure 1. Storage (G′) and loss (G″) moduli of BC membranes holding 100, 80 and 50% water, measured as a function of strain (left) and frequency (right).
Notes: The red dots indicate the interceptions between G′ and G″.
Figure 2. Representative Nyquist plots of BC membranes with 100% (never-dried membrane), 80 and 50% water content.
Figure 3. Randles circuit used for fitting the experimental data.
Notes: The solid lines (─) represent the respective fittings.
Table 1. Average values of bulk resistance Rs, polarization resistance Rp, constant phase element CPE and N values of Randles circuit used to fit the experimental data of six never-dried BC membranes per BC water content (100, 80 and 50%).
Figure 4. Experimental weight-loss (solid square ■) and respective modelling (solid line ─) of BC membranes 8 mm thick and 8 mm of diameter (T8D8), 8 mm thick and 5 mm of diameter (T8D5), 2 mm thick and 8 mm of diameter (T2D8) and 2 mm thick and 5 mm of diameter (T2D5).
Notes: The weight-loss curves of each size/thickness correspond to an average of five samples and the error bars correspond to the respective standard deviations.
Table 2. Rate coefficients obtained from the model expressed in Equation (Equation2 (2) (2) ) that gives the best agreement with the experimental data. It is also related to surface area to volume ratio for each sample’s dimension.
Table 3. Influence of changes to the values of the rate constants in the model.
Figure 5. Schematic of the molecular structure of bacterial cellulose and their bound and free water.
Supplemental material