Figures & data
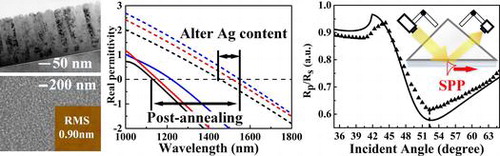
Figure 1. Surface and cross-sectional morphologies of as-deposited Ag-ITO films with different silver contents, obtained from (a)–(c): Cross-sectional SEM (insets: schematic of the distributions for Ag and ITO particles and different growth stages); (f)–(h): Surface SEM (insets: AFM images) and (d)–(e): TEM.
Figure 2. XRD patterns of Ag-ITO films with different silver contents compared with pure ITO films under identical fabrication conditions (see labels for details).
Figure 3. Wide range of λ c and ENZ tuning can be achieved by optimizing the silver content and post-annealing parameters: (a) Real permittivity for Ag-ITO films (inset: real permittivity for pure ITO films); (b) Imaginary permittivity; (c) Hall measurements for the annealed films (inset: as-deposited films); (d) Experimental data and linear fitting of λ c vs. square root of carrier concentration.
Figure 4. ENZ region for Ag-ITO films with different silver contents: (a) Experimental data of as-deposited Ag-ITO films; (b) Experimental data of annealed Ag-ITO films; (c) Effective medium approximation based on extended Maxwell-Garnett model which takes silver and ITO as constituents and air as host.
Figure 5. Reflectance curves for annealed Ag-ITO films vs. incident angle at the wavelength of 1550 nm: (a) Schematic of the prism-coupling configuration; (b)–(d) Experimental results by prism-coupling; and simulation by transfer-matrix method for sample 1, 2, and 3, respectively.