Figures & data
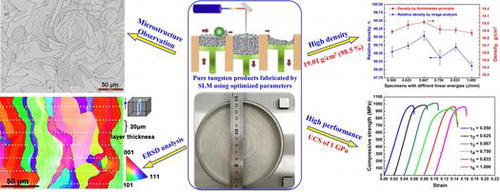
Figure 1. SEM morphology (a) and size distribution (b) of the pure tungsten powder.
Table 1. Physical parameters used for theoretical calculation in laser parameters design.
Figure 2. Schematic diagram of the SLM process and the heat transfer in molten pool.
Figure 3. Optical images of SLM fabricated pure tungsten parts: (a) blocks fabricated with different linear energies; (b) 0.40 mm thin-wall tungsten part and specimens produced with η 3 = 0.667 J/mm.
Figure 4. Surface morphology and roughness taken from horizontal surfaces of SLM fabricated pure tungsten: (a) SEM image showing regular laser tracks (η 3 = 0.667 J/mm) and microcracks (inset image); (b) corresponding high-magnification SEM image showing massive nanocrystals in the liquid fronts; (c) the corresponding 3D topography image of the untreated fresh surface and (d) relationships between surface roughness and linear energy summarized from the 3D topography images.
Figure 5. Optical micrographs showing the pores in the horizontal cross-sections of pure tungsten produced by SLM with different linear energies (J/mm): (a) η 1 = 0.500, (b) η 2 = 0.625, (c) η 3 = 0.667, (d) η 4 = 0.750, (e) η 5 = 0.833, (f) η 6 = 1.000; (g) density graphs obtained from Archimedes and image analysis methods.
Figure 6. Microstructural observation and phase identification taken from horizontal cross-sections of SLM-produced pure tungsten: (a) low-magnification and (b) high-magnification OM macrographs; (c) low-magnification (inset) and high-magnification SEM morphologies, and (d) XRD patterns of powder and SLM-produced specimens.
Figure 7. SEM and EBSD analysis carried along the building direction (Z direction): (a) SEM image showing a crack along building direction and (b) Inverse pole figure showing the microstructure and grain orientation map of SLM-produced tungsten.
Figure 8. (a) The effect of laser linear energy on microhardness of SLM-processed pure tungsten and (b) compressive stress–strain curves of SLM fabricated pure tungsten with different laser linear energies.