Figures & data
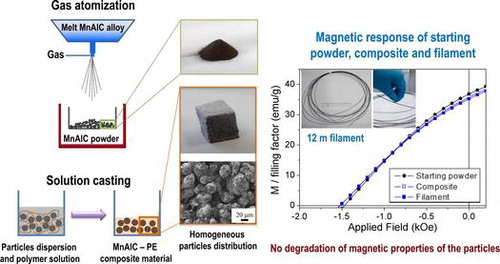
Figure 1. (a) Scheme of the gas atomization and annealing processes of MnAlC alloy to obtain quasi-spherical particles with different crystallographic structure. SEM image showing the microstructure and XRD spectrum of the crystallographic structure of ε-phase based particles ((b) and (c), respectively) and τ-phase based particles ((d) and (e), respectively). Insets in (b) and (d) show a closer view of the microstructure. (f) Scheme of the solution casting method used for the synthesis of MnAlC – PE composite materials.
Figure 2. (a) Starting polyethylene (PE), MnAlC powder, and synthesized MnAlC-PE composite; dissolved PE before (b) and after (c) toluene evaporation; (d) PE and MnAlC powders in toluene solution; MnAlC-PE composite with different MnAlC particles content into the PE matrix: (e) 63.1%, and (f) 86.5%.
Figure 3. SEM images of composite materials with a filling factor of (a) 86.5% and (b) 63.1%. Insets show detail of the microstructure.
Figure 4. (a) VSM hysteresis loops measured for the starting MnAlC powder and the composites (1 and 2) with different filling factor (86.5 and 63.1% in mass, respectively); and (b) detail of the second quadrant of the hysteresis loops.
Table 1. Magnetic properties of MnAlC powder, MnAlC – PE composite materials and magnetic filaments: coercive field (H c ), remanence (M r ), and magnetization measured at a maximum applied magnetic field of 20 kOe (M 20kOe).
Figure 5. Second quadrant of the hysteresis loops with the magnetization (M) normalized to the filling factors of the composite 1 (86.5%) and the filament 1 (72.3%). Measurement for the starting MnAlC powder is included for comparison.
Figure 6. (a) Extruded MnAlC–PE magnetic filament (a 20 cm ruler is included for scale comparison); SEM images of (b) MnAlC–PE filament showing its circular cross section, and internal filament morphology for different filling factors: (c) 72.3% and (d) 52.1%.
Figure 7. VSM hysteresis loops for extruded MnAlC – PE filaments with different filling factors expressed in mass: (a) 72.3% and (b) 52.1%. Hysteresis loops for the corresponding composites (1 and 2) are included for comparison. In both graphs, a detail of the second quadrant of the hysteresis loops is included as inset.