Figures & data

Figure 1. DSC thermograms of IL-CdTe NP composites with (a) P12-, (b) P14- and (c) P18Tf2N together with those of 1-alkyl-1-pyrrolidinium salts without NPs
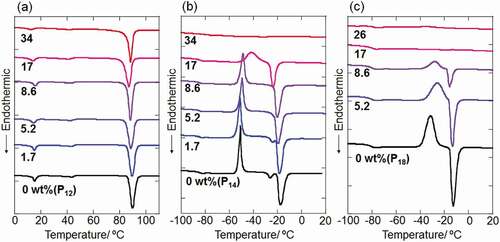
Figure 2. Plots of relative melting enthalpy of 1-alkyl-1-methylpyrrolidinium Tf2 N salts as a function of NP-volume fraction. ΔH0 corresponds to the melting enthalpy of ILs without NPs
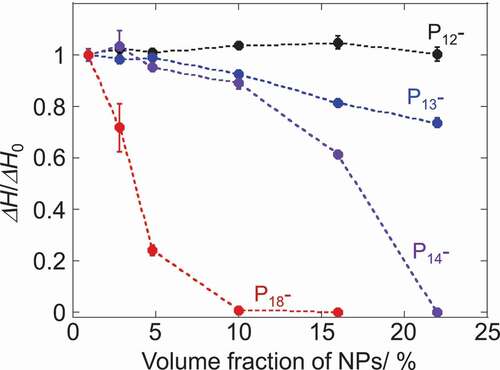
Figure 3. Plots of estimated solvation layer thickness on NPs in 1-alkyl-1-methylpyrrolidinium Tf2 N salts as a function of NP-volume fraction together with a schematic representation of solvation layer (above)
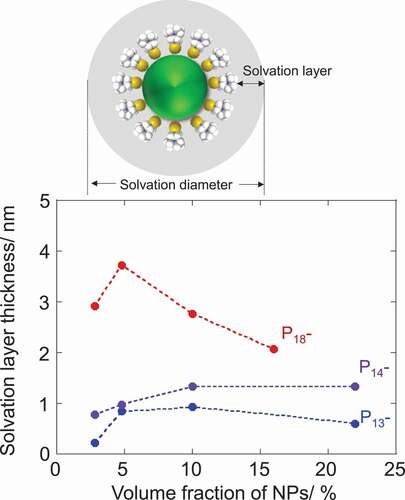
Figure 4. XRD patterns of P18Tf2N, TC-Tf2 N capped CdTe NPs and 4.8vol% composite
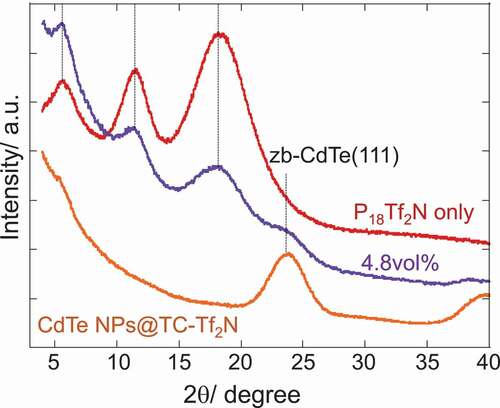
Figure 5. 19F NMR spectra of (a) P18Tf2N and (b) its composite with CdTe NPs (10vol%) and (c) their full width at half-maximum (FWHM)
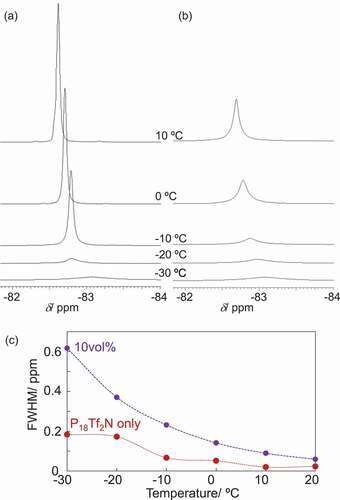
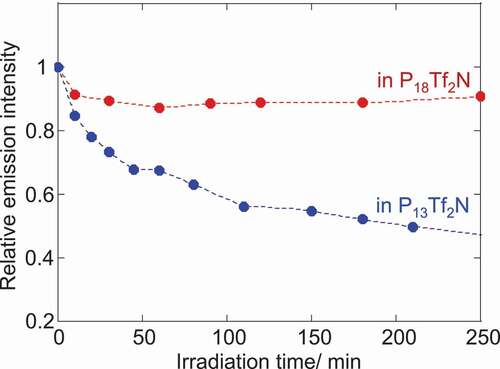
Figure 6. Relative emission intensity of CdTe NPs in ILs under visible irradiation (λ > 440 nm). (NPs concentration: 1.0 × 10⁻⁵M)