Figures & data
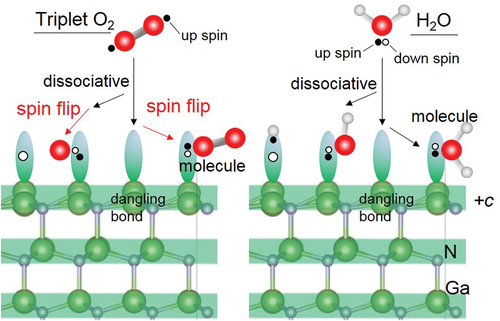
Table 1. List of irradiation conditions of oxidant gas during XPS measurement
Figure 1. O 1s spectra detected every 30s by XPS under H2O ambient at 9.0 × 10⁻⁶ Pa for (a) +c GaN and (b) m-GaN surface after annealing at 900°C for 20 min. The initial chemical states are indicated by black lines. The blue lines show the spectra detected at the specific exposure time as indicated in the figure. The dotted lines show the spectra decomposed for +c GaN irradiated for 3 min and m-GaN after annealing.
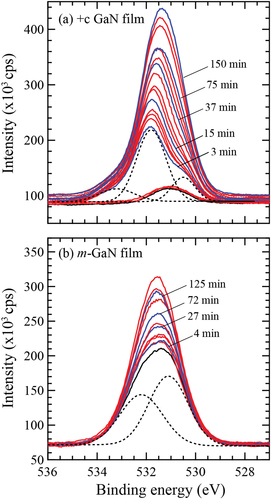
Figure 2. Variation of O 1s area detected by XPS upon exposing +c (red), −c (blue) and m- (green) GaN surfaces to each oxidant gas. The value of the initial area for each gas was shifted to improve legibility. The shutter introducing oxidation gas was open after a few scans of O1s core spectrum in the real-time XPS measurement.
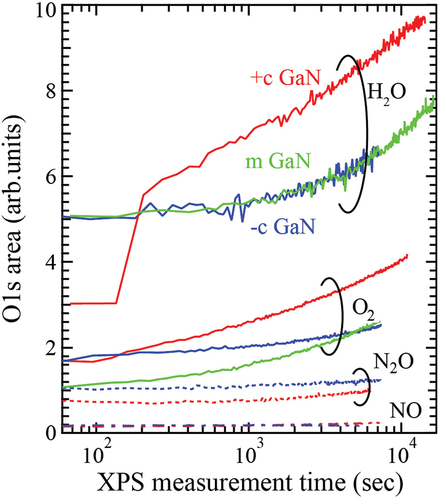
Figure 3. Optimized structures of H2O molecule obtained from DFT for (a) physisorption H2O and (b) chemisorption H2O on +c GaN surface, and (c) −c GaN surface. Green and gray spheres indicate Ga and N atoms, respectively. Red and pink spheres indicate O and H atoms, respectively. The bond lengths involved in H2O adsorption are shown.
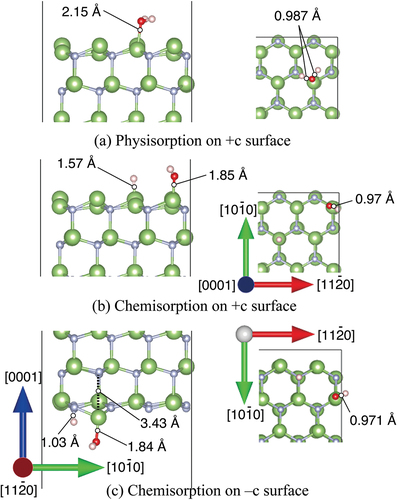
Table 2. Adsorption energy of H2O on GaN surfaces. The corresponding figure number is added after each adsorption energy
Figure 4. Density of state for (a) no adsorption of H2O on +c/−c GaN surface called ‘Desorbed’, (b) physisorption and (c) chemisorption of H2O on +c GaN, and (d) chemisorption of H2O on – c GaN surface. The positive and negative value of DOS indicate alpha and beta electrons respectively. See Fig. 1S-1 for indices of each layer of the GaN slab.
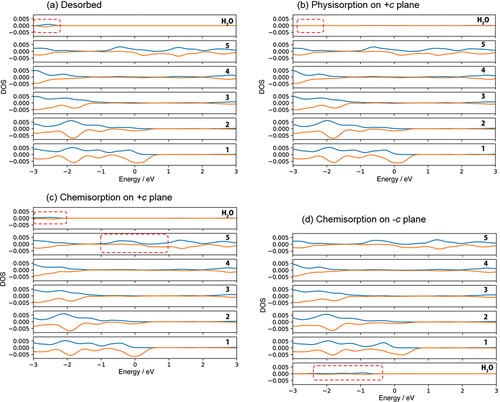
Figure 5. Optimized structures of H2O molecule obtained from DFT on m-GaN surface exhibiting two types: (a) chemisorption 1 in which reconstruction takes place, and (b) chemisorption 2 forming the GaO bond directly. Green and gray spheres indicate Ga and N atoms, respectively. Red and pink spheres indicate O and H atoms, respectively. The bond lengths and distance relevant to H2O adsorption are shown.
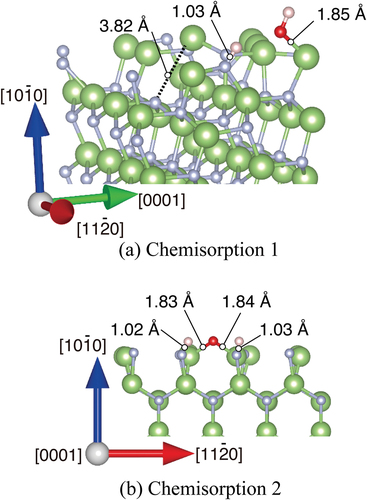
Figure 6. DOS of (a) no adsorption of H2O on m-GaN surface called ‘Desorbed’, and (b) dissociative H2O adsorption on the enhanced m-plane of Chemisorption 1. The number on right hand side indicates the layers of m-GaN slab model of MD-calculation (See Fig. 1 S-1, Supporting information). The positive and negative value of DOS indicate alpha and beta electrons respectively. See Fig. 1 S-1 for indices of each layer of the GaN slab.
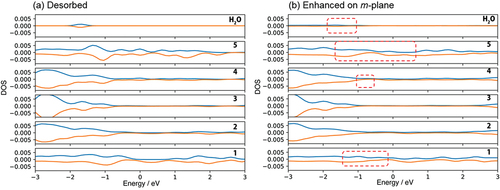
Figure 7. Radial distribution function of Ga-O on (a) +c/−c planes and (b) m-plane using the trajectory obtained by MD calculation during last 90 ps.
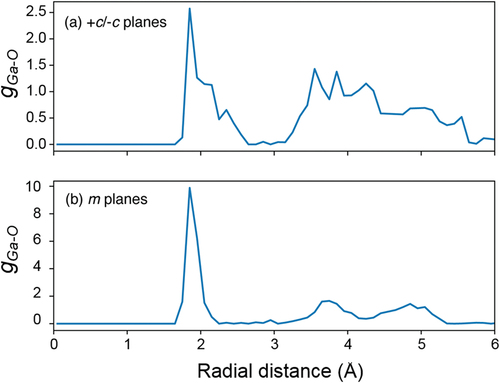
Figure 8. Snapshots of (a) +c/−c GaN surface slab, and (b) m-GaN surface slab interaction with H2O molecules during DF-MD at 500 K. Green and gray spheres indicate Ga and N atoms, respectively. Red and pink spheres indicate O and H atoms, respectively.
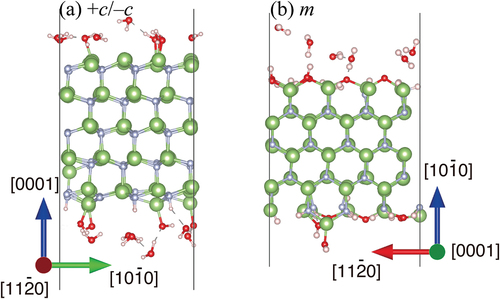
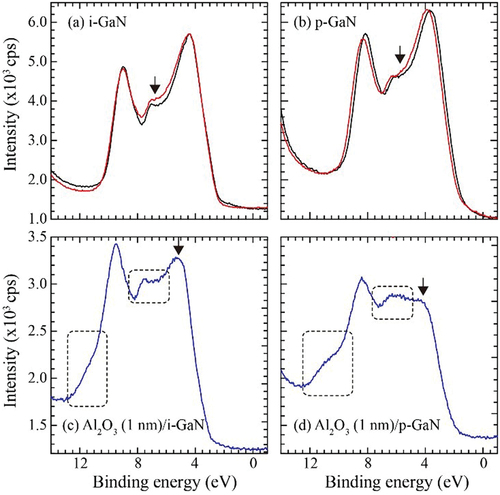
Figure 9. Valence band spectra: (a) i-GaN and (b) p-GaN exposed to O2 molecule beam for 2 hours (red). The black lines represent those of as-installed samples. The intensity at lower binding energy was normalized. (c) Al2O3 (1 nm)/i-GaN and (d) Al2O3 (1 nm) /p-GaN. The Al2O3 layer was deposited by ALD using H2O vapor.