Figures & data
Figure 1. (a) The Antarctic Ice Sheet showing key locations mentioned in the text. PIG: Pine Island Glacier; TG: Thwaites Glacier. Background image: REMA elevation model (Howat et al., Citation2019). (b) The bed of the Antarctic Ice Sheet, showing key locations mentioned in the text. Note the large deep marine basin beneath West Antarctica, between Marie Byrd land and Ellsworth Land. From: Morlighem et al., Citation2020.
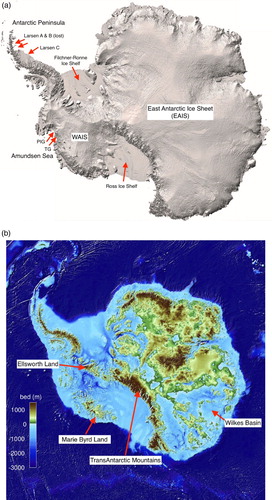
Figure 2. Elevation changes on the Antarctic Ice Sheet showing slight thickening over most of the continent and rapid thinning in the Amundsen Sea Sector od WAIS and in Wilkes Land. PIG: Pine Island Glacier; TG: Thwaites Glacier (From Smith et al., Citation2020).
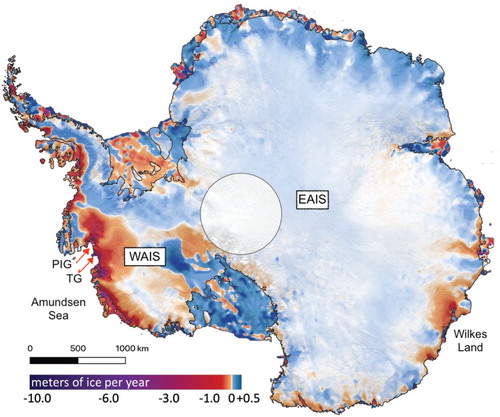
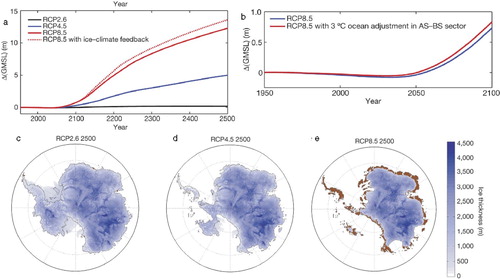
Figure 3. Predicted sea level rise and mass loss from the Antarctic Ice Sheet under IPCC CO2 emission scenarios RCP2.6 (low), 4.5 (medium) and 8.5 (high), using a model with a simple representation of the ice cliff instability. (a) Sea level rise until 2500. (b) twenty-first Century sea level rise under RCP 8.5 (continued growth of CO2 emissions). (c-e) Configuration of Antarctic Ice Sheet in 2500, in alternative carbon futures. From: DeConto & Pollard, Citation2016.