
Figures & data
Figure 1. (a–c) Active arctic talus rock glaciers on Svalbard, at (a) Vardeborgsletta, (b) Revdalen, and (c) Adventfjorden. (d) Large lobate alpine talus rock glacier, Muragl, Engadin, Switzerland. (e, f) Relict lobate alpine talus rock glaciers on Mt Olympus and the Roberts Range, New Zealand. Images: (a) Ole Humlum; (b) Zuzanna Swirad; (d) Regula Frauenfelder; (c, e and f) the author.
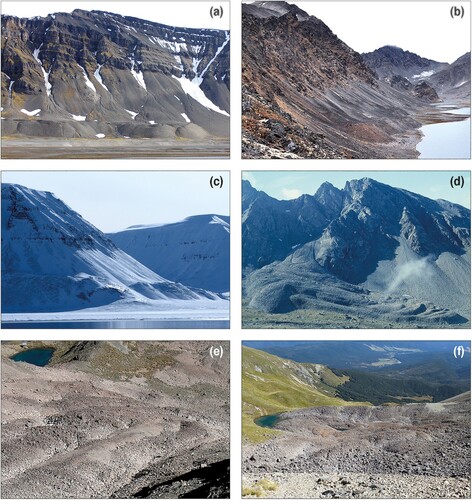
Figure 2. Subdivision of the Lateglacial period in the British Isles, showing oxygen isotope (δ18O) fluctuations in the Greenland ice core record for the 17–10 ka. Also shown are mean July temperatures inferred from subfossil chironomid assemblages in southern Scotland by Brooks and Birks (Citation2000).
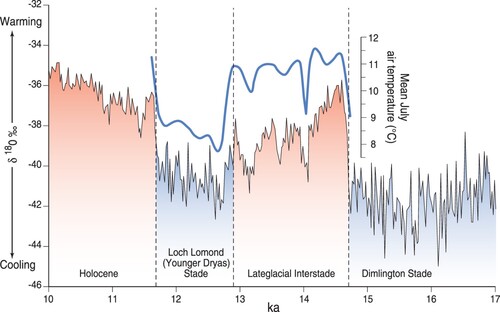
Figure 3. Distribution of landforms and soil structures that demonstrate Lateglacial permafrost down to sea level in Scotland, and limit of glacier ice during the Loch Lomond Stade.
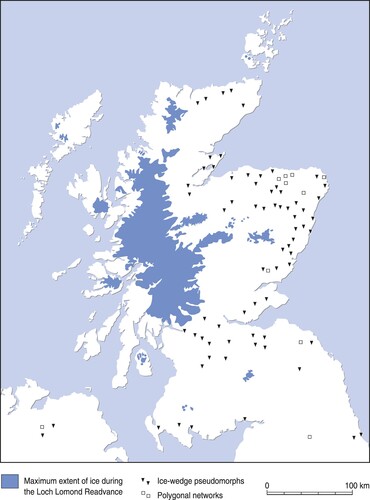
Figure 4. Haeberli’s (Citation1985) model of climatic constraints on talus rock glacier formation. Although approximate, it illustrates the requirement for permafrost and how TRGs are unlikely to form at sites where high precipitation (snowfall) favours the development of glacier ice.
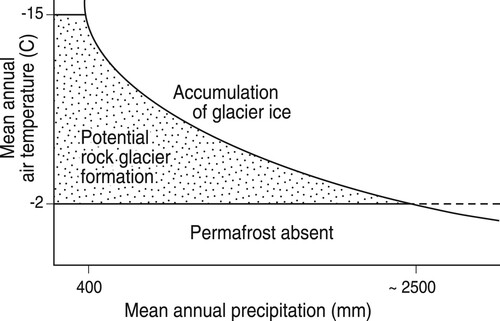
Figure 5. Vertical satellite image (Google EarthTM) of the northern corries of Braeriach, showing the location of the three landforms here interpreted as talus rock glaciers. The location of the Loch Lomond Stadial terminal moraine in Coire an Lochain is also shown. Coire Ruadh and Coire Beanaidh lack evidence of reoccupation by glacier ice during the Loch Lomond Stade.
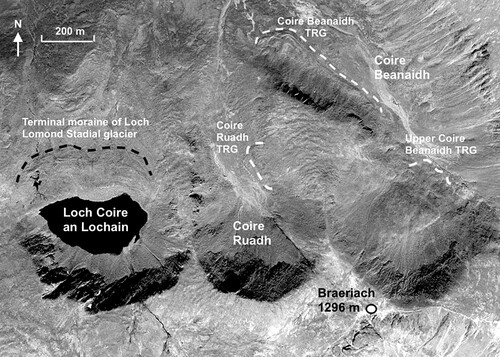
Figure 6. The Coire Beanaidh relict talus rock glacier. (a) Oblique satellite image showing how the steep-fronted debris bench to the SE (left) broadens to the NW, forming a distinct lobe containing two to four nested debris ridges (Google EarthTM image). (b) Photograph of the rock glacier from the opposite side of Coire Beanaidh. (c) View SE along the debris bench. (d) The terminal ridge at the NW end of the lobate section.
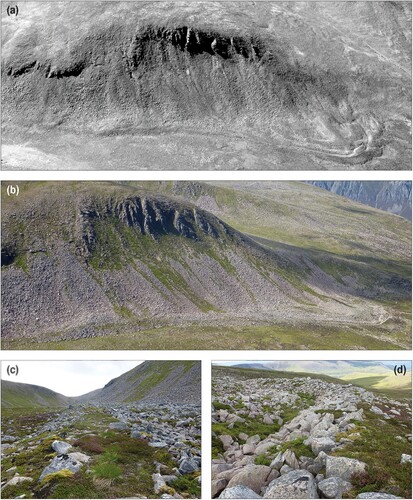
Figure 7. Oblique satellite image of overlapping arcuate ramps or ridges of bouldery debris (arrowed) in upper Coire Beanaidh, viewed from the northeast. These have apparently formed though downslope deformation of subsurface ice or ice-supersaturated sediment and are interpreted as representing an incipient rock glacier (Google EarthTM image).
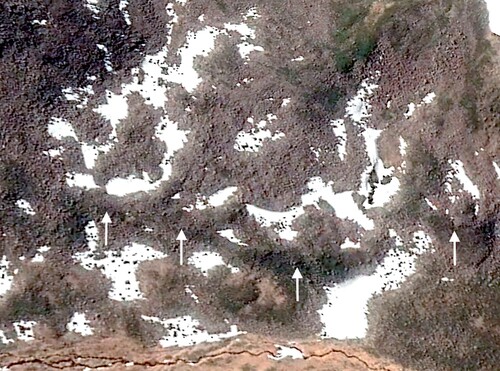
Figure 8. The Coire Ruadh relict rock glacier. (a) Surface of the rock glacier, looking SE towards the head of Coire Ruadh. (b) Collapse pit, 4.5 m deep, inferred to have been produced by melt of subsurface ice. (c) SW-facing frontal ramp of the rock glacier, ∼10 m high. (d) Detail of boulders in the frontal ramp. The pole is one metre long.
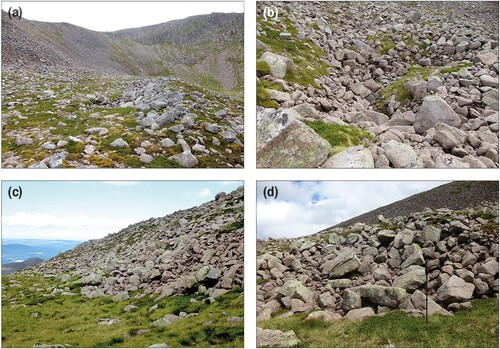
Table 1. Empirically-derived estimates of talus rock glacier thickness.