
Figures & data
Figure 1. Theoretical underpinning.
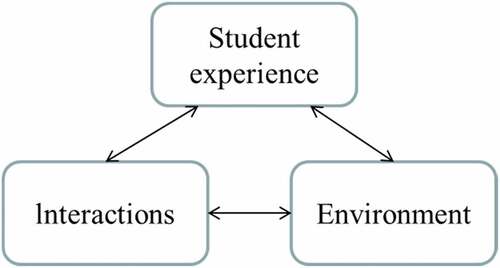
Table 1. Descriptive statistics.
Table 2. Correlation Matrix: Learning experience and the home situation.
Table 3. Descriptive statistics by course level.
Table 4. Independent samples – masters and bachelors.
Table 5. Linear regression (Dependent variable Q4: Online classroom learning experience).