
Figures & data
Figure 1. Location of Western Kenya with eight counties (dark lines) and 62 sub-counties (numbered, see note) relative to Kenya and Africa. Notes: Bungoma county: Bumula (1), Kabuchai (2), Kanduyi (3), Kimilili (4), Mt. Elgon (5), Sirisia (6), Tongaren (7), Webuye East (8), Webuye West (9); Busia county: Bunyala (10), Butula (11), Samia (12), Matayos (13), Nambale (14), Teso North (15), Teso South (16); Homa Bay county: Homa Bay (17), Rachuonyo East (18), Rachuonyo North (19), Rachuonyo South (20), Suba North (21), Ndhiwa (22), Rangwe (23), Suba South (24); Kakamega county: Butere (25), Ikolomani (26), Khwisero (27), Likuyani (28), Lugari (29), Lurambi (30), Malava (31), Matungu (32), Mumias East (33), Mumias West (34), Navakholo (35), Shinyalu (36); Kisumu county: Kisumu Central (37), Kisumu East (38), Kisumu West (39), Muhoroni (40), Nyakach (41), Nyando (42), Seme (43); Migori county: Awendo (44), Kuria East (45), Kuria West (46), Nyatike (47), Rongo (48), Suna East (49), Suna West (50), Uriri (51); Siaya county: Alego-usonga (52), Bondo (53), Gem (54), Rarieda (55), Ugenya (56), Ugunja (57), Vihiga county: Emuhaya (58), Hamisi (59), Luanda (60), Sabatia (61), Vihiga (62).
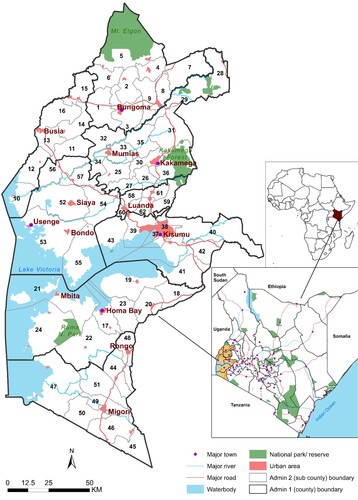
Table 1. Summary of data assembled including school databases, factors that affect travel between home and schools, and population data for primary school-going children.
Figure 2. Public primary schools in 2009 (a) and 2020 (b), with corresponding modelled walking travel time to the nearest school in 2009 (c) and 2020 (d) in Western Kenya.
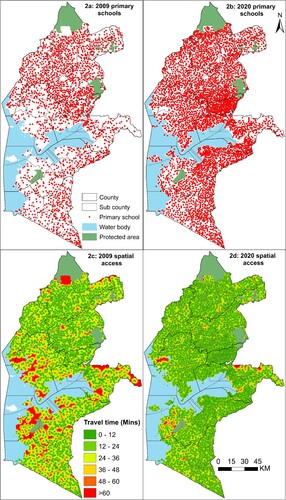
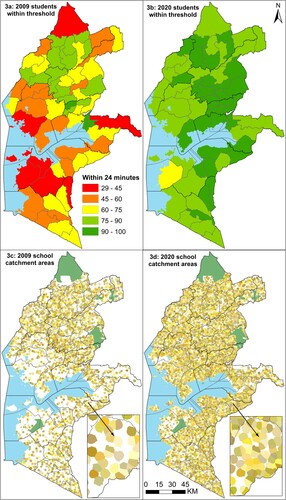
Figure 3. Proportion of primary school-going children within the recommended threshold of 24 min (2 km) by sub-county in 2009 and 2020 (top panel) and the corresponding school catchment areas (coloured) (bottom panel).
Supplemental Material
Download MS Word (316.6 KB)Data availability statement
The data associated with the findings in this manuscript is available at https://doi.org/10.7910/DVN/5N8LW2.