
Figures & data
Figure 1. Preferred Reporting Items for Systematic reviews and Meta-Analysis (PRISMA) flow diagram describing the results of the systematic literature search and additional selection based on exclusion criteria. LTP = local tumor progression.
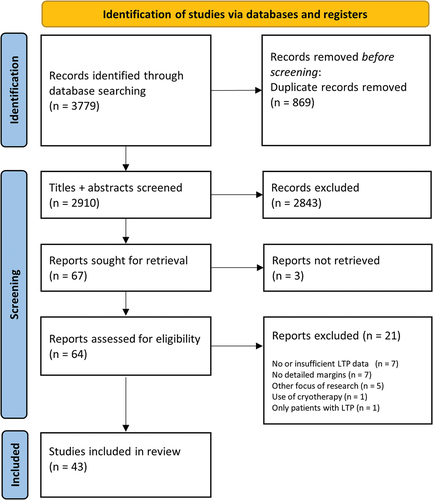
Table 1. Characteristics of articles included in this review. NR = not reported; PS = prospective; RS = retrospective; RFA = radiofrequency ablation; MWA = microwave ablation; LTP = local tumor progression; HCC = hepatocellular carcinoma; CRLM = colorectal liver metastases; AM = ablative margin; 3D-QAM = three-dimensional quantitative ablative margin; NLR = neutrophil-lymphocyte ratio, 3D-CEUS-FI = three-dimensional contrast enhanced ultrasound fusion imaging.
Figure 2. Risk of bias according to Newcastle-Ottawa Scale for selection, comparability, outcome and overall risk of bias.
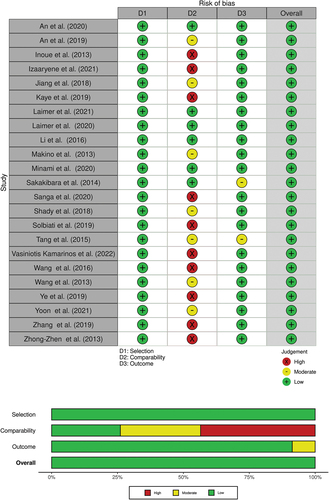
Table 2. Ablative margin and measurement characteristics of studies investigating hepatocellular carcinoma. AM = ablative margin; LTP = local tumor progression; CT = computer tomography; CECT = contrast enhanced CT; MRI = magnetic resonance imaging; CEMRI = contrast enhanced MRI; US = ultrasound; CEUS = contrast enhanced US. *Results from rigid registered analysis is given; **Results from non-rigid registered analysis is given.
Figure 3. Forest plot and risk difference calculation for studies investigating HCC. LTP = local tumor progression; AM = ablative margin.
Table 3. Ablative margin and measurement characteristics of studies investigating colorectal liver metastases. AM = ablative margin; LTP = local tumor progression; CT = computer tomography; CECT = contrast enhanced CT; MRI = magnetic resonance imaging; CEMRI = contrast enhanced MRI. *Results from rigid registered analysis is given.
Figure 4. Forest plot and risk difference calculation for studies investigating CRLM. LTP = local tumor progression; AM = ablative margin.
Table 4. Ablative margin and measurement characteristics of studies investigating mixed populations of HCC and CRLM. AM = ablative margin; LTP = local tumor progression; CT = computer tomography; CECT = contrast enhanced CT; MRI = magnetic resonance imaging; CEMRI = contrast enhanced MRI; CEUS = contrast enhanced ultrasound. * sufficient ablative margin is categorized as >5 mm for HCC, > 10 mm for CRLM.