
Figures & data
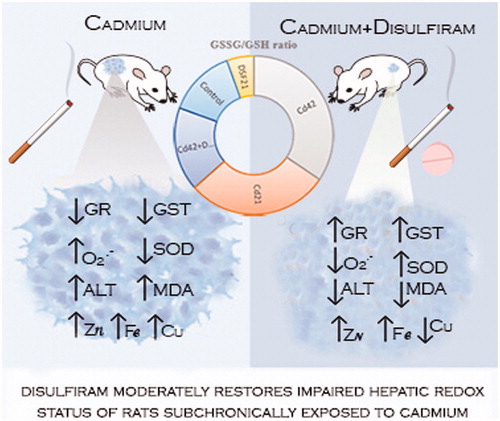
Table 1. Parameters of oxidative status in the liver of male Wistar rats exposed solely to Cd or DSF.
Table 2. Parameters of glutathione cycle in the liver of male Wistar rats exposed solely to Cd or DSF.
Table 3. Parameters of oxidative status in the liver of male Wistar rats co-exposed to Cd and DSF.
Table 4. Metal content in the liver of male Wistar rats.
Figure 1. Representative graphs of oxidative status in liver of Wistar rats intact and administered Cd, DSF and a combination of both substances. *See the experimental conditions presented in the section Experimental design. Values are presented as means ± S.D. Labels of statistical significance: compared with the control group (*) and compared with Cd42 subgroup (°). Statistical significance was considered at: ∗p < 0.01, ∗∗p < 0.001, ∗∗∗p < 0.0001 and °°°p < 0.0001. (A) Superoxide anion radical content (O2·−): presented parameter of OS (expressed as nmol red NBT/mg proteins). (B) Lipid peroxidation: parameter of OS presented as MDA level (expressed as nmol MDA/mg proteins). (C) SOD activity: presented parameter of antioxidative defence (expressed as U SOD/mg proteins). (D) CAT activity: presented parameter of antioxidative defence (expressed as U CAT/mg proteins).
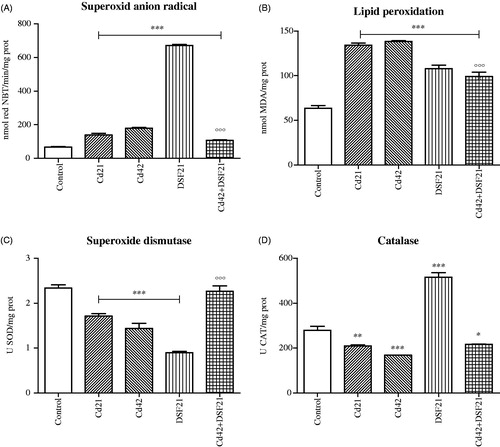
Figure 2. Representative graphs of glutathione cycle in liver of Wistar rats intact and administered Cd, DSF and a combination of both substances. *See the experimental conditions presented in the section Experimental design. Values are presented as means ± S.D. Labels of statistical significance: compared with the control group (*) and compared with Cd42 subgroup (°). Statistical significance was considered at: ∗p < 0.01, ∗∗p < 0.001, ∗∗∗p < 0.0001 and °°°p < 0.0001. (A, B) Reduced and oxidized glutathione content: presented parameters of antioxidative defence (obtained values, expressed in μM, were recalculated in regard to protein status and expressed as nmol GSH or GSSG/mg proteins for the appropriate discussion of the obtained results). (C) Ratio of oxidized and reduced glutathione: presented parameter of glutathione homeostasis (values are presented as means of GSSG/GSH ratio through chosen time points). (D) GR activity: presented parameter of antioxidative defence (expressed as U GR/mg proteins). (E) GST activity: presented parameter of antioxidative defence (expressed as U GST/mg proteins). (F) GPx activity: presented parameter of antioxidative defence (expressed as U GPx/mg proteins).
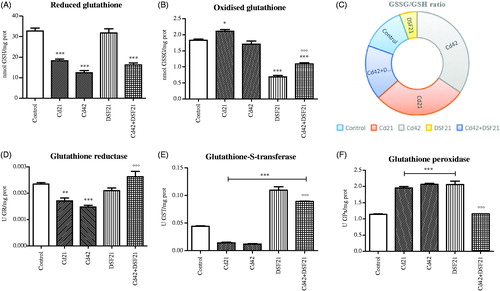
Figure 3. Representative graphs of metal content in liver of Wistar rats intact and administered Cd, DSF and a combination of both substances. *See the experimental conditions presented in the section Experimental design. Values are presented as means ± S.D. Labels of statistical significance for toxic metal Cd: compared with the Cd1 group (*) and compared with Cd42 subgroup (°). Labels of statistical significance for essential metals (Cu, Fe, Zn, Mg, Se): compared with the control group (*) and compared with Cd42 subgroup (°). Statistical significance was considered at: ∗p < 0.01, ∗∗p < 0.001, ∗∗∗p < 0.0001, °°p < 0.001 and °°°p < 0.0001. (A) Cd content (expressed as μg Cd/g liver tissue). (B) Cu content (expressed as μg Cu/g liver tissue). (C) Fe content (expressed as μg Fe/g liver tissue). (D) Zn content (expressed as μg Zn/g liver tissue). (E) Mg content (expressed as μg Mg/g liver tissue). (F) Se content (expressed as ng Se/g liver tissue).
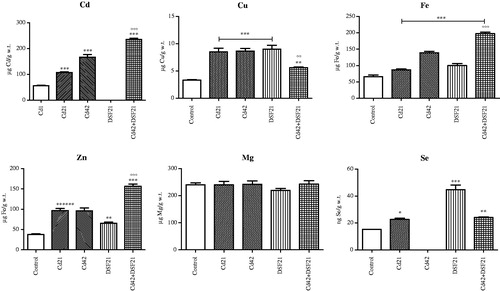
Figure 4. Representative photomicrographs of liver sections from Wistar rats exposed i.p. to 1 mg CdCl2/kg BW/day (for 21 and 42 days) and orally to 178.5 mg DSF/kg BW/day (for 21 days), individually and/or in combination: (A) Control/intact group, showing normal appearance; (B) Cd21: showing infiltration of neutrophils (N) and focal necrosis (F). (C) Cd42: showing infiltration of neutrophils (N) and neutrophil infiltration of sinusoids (NS). (D) DSF21: showing normal appearance; and (E) Cd42 + DSF21: group showing infiltration of neutrophils (N), neutrophil infiltration of sinusoids (NS) and focal necrosis (F).
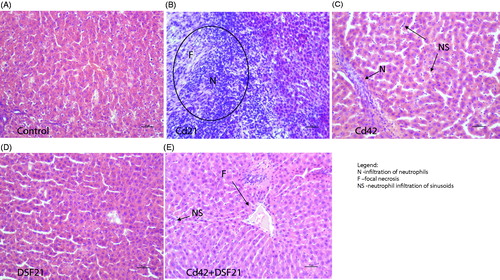
Table 5. Serum aminotransferases analysis in male Wistar rats.
Table 6. Spearman correlation between OS parameters and/or relevant metals in the liver of the Wistar rats subacutely exposed to Cd and DSF, subchronically exposed to Cd and subchronically co-exposed to Cd and DSF.