
Figures & data
Figure 1. Effect of DMSO on aldose reductase activity. Inhibition data of DMSO on AR are reported in double reciprocal plots. Panel A: AR activity was determined using different L-idose concentrations, both in the absence (circle) and in the presence of 40 mM (triangle), 100 mM (square), and 200 mM (diamond) DMSO. Panel B: AR activity was determined using different HNE concentrations, both in the absence (circle) and in the presence of 100 mM (triangle), 200 mM (square), and 300 mM (diamond) DMSO.
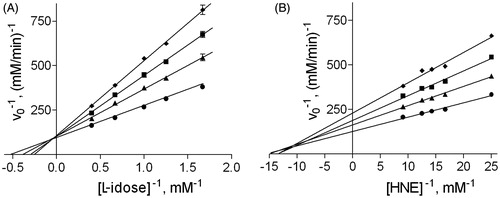
Figure 2. Effect of DMSO on the inhibition of AR by NHDC. Panel A and B: AR activity was determined using different L-idose concentrations in the presence of 0 (circle), 50 (triangle), 100 (square), or 150 (diamond) µM NHDC, both in the absence (Panel A) and in the presence of 100 mM DMSO (Panel B). AR activity was determined using different HNE concentrations, both in the presence of 0 (circle), 50 (triangle), and 100 (square) µM NHDC both in the absence (Panel C) and in the presence of 200 mM DMSO (Panel D).
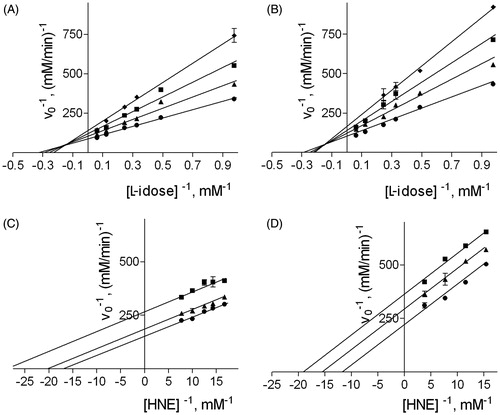
Table 1. Inhibition constants of neohesperidin dihydrochalcone, rutin and phloretin for the reduction of L-idose, or HNE determined at different DMSO concentrations.
Figure 3. Kinetic model of mutual exclusion inhibition by DMSO and a generic inhibitor on the transformation of a generic substrate. See the text for an explanation of the symbols.
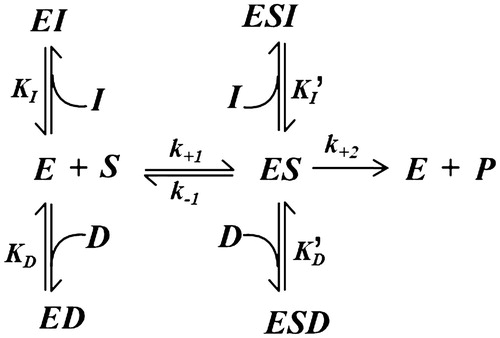
Figure 4. Simulation of the effect of DMSO on the inhibition of AR by NHDC, rutin, and phloretin. A computer-assisted plot was generated to simulate the effect of DMSO, described by Equation (1), on the inhibition of AR, using both L-idose (left Panels) and HNE (right Panels) as substrate. The kinetic parameters adopted in the simulation were as follows: i) VMAX and KM for L-idose as substrate were 0.011 mM/min and 2.3 mM, respectively; ii) VMAX and KM for HNE as substrate were 0.008 mM/min and 0.07 mM, respectively; iii) the inhibition kinetic parameters (i.e. Ki and Ki') referring to DMSO and to the three tested inhibitors are reported in . In each panel, curves 1, 2, and 3 were obtained both in the absence (solid line) and in the presence of 200 mM (dashed line) DMSO at the following inhibitor concentrations: NHDC 0, 50, and 100 µM, respectively (Panels A and B), rutin 0, 5, and 15 µM, respectively (Panels C and D), phloretin 0, 25, and 100 µM, respectively (Panels E and F).
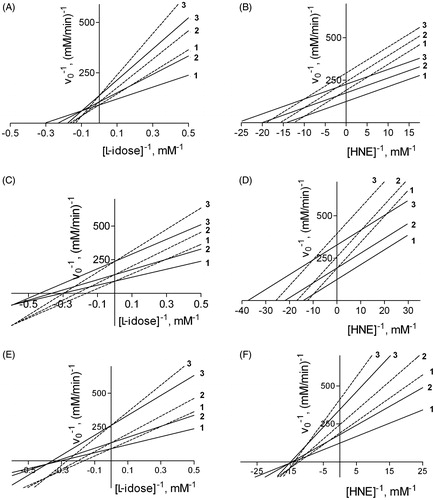
Table 2. Inhibition constants of neohesperidin dihydrochalcone, rutin and phloretin for the reduction of L-idose or HNE obtained through a computer assisted simulation at different DMSO concentrations.