Figures & data
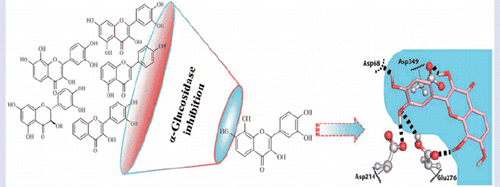
Figure 1. Chemical structures of the tested flavonoids.
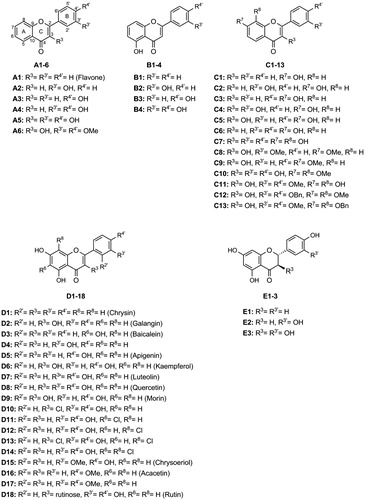
Table 1. Structures and in vitro α-glucosidase inhibition by the studied flavonoids (IC50 μM, mean ± SEM).
Table 2. Ki values (mean ± SEM, μM) for the inhibition of yeast α-glucosidase by the selected flavonoids.
Figure 2. Lineweaver–Burk double reciprocal plots of α-glucosidase inhibition by A5 (A), B3 (B), C7 (C), D8 (quercetin) (D), D10 (E), E3 (taxifolin) (F) and acarbose (G).
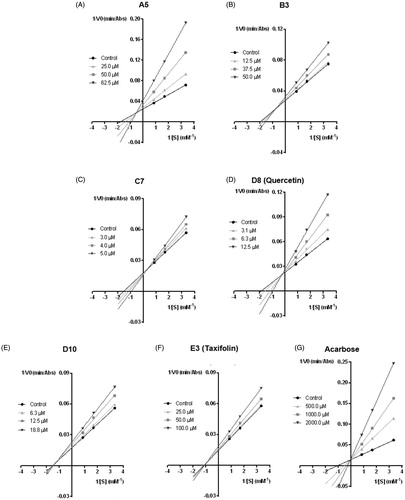
Figure 3. Predicted binding poses for acarbose (A) and flavones A5 (B), B1 and B3 (C), C7 (D), D8 (quercetin) (E), D10 (F) and E3 (taxifolin) (G). Hydrogen bonds are represented by dashed lines. (B) B1 is coloured salmon and B3 light blue. The residues that establish the most relevant interactions are also shown. Asp214 and Glu276 are the catalytic residues that participate in the hydrolysis reaction. Asp349 is also a conserved residue.
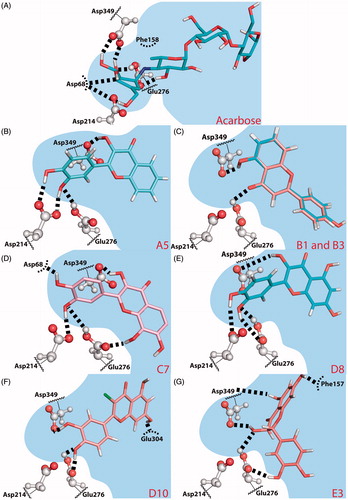
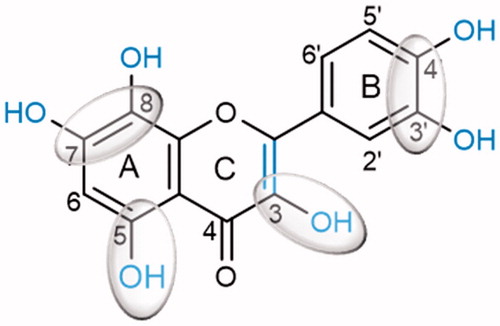
Figure 4. Potential flavonoids ‘substitution pattern that contributes to increase the α-glucosidase inhibition.