
Figures & data
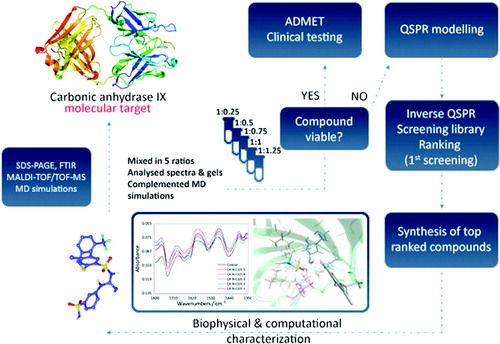
Figure 1. Flowchart of the proposed drug discovery methodology.
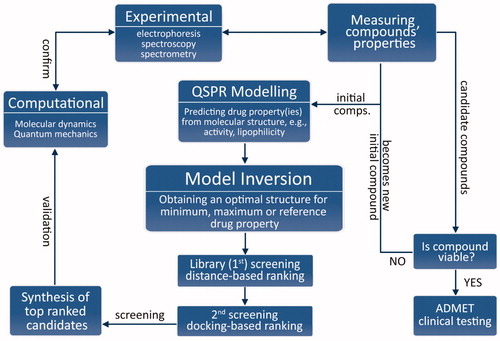
Table 1. Testing set ligands used for QSPR modeling and structural studies.
Table 3. Final ranking after validation through molecular docking.
Figure 2. Representative mixture of five sulphonamides separated using RP-LC and a linear gradient from 0 to 95% acetonitrile in the mobile phase in a time of 0–40 min.
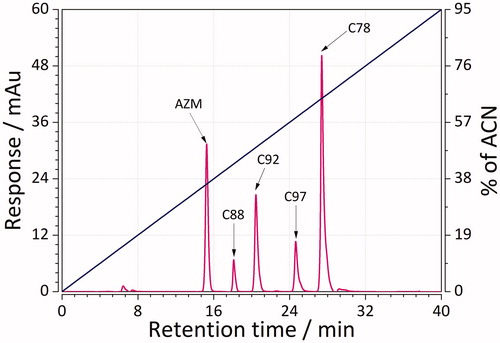
Figure 3. Representative mixture of five sulphonamides separated using RP-LC and a linear gradient from 0 to 95% acetonitrile in the mobile phase in a time of 0–60 min.
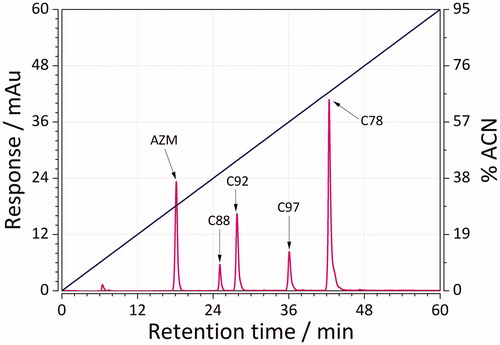
Figure 4. Predictive ability of the GA-PLS QSRR model for the training and testing set ligands. Empty hexagons denote log Ki, while empty circles denote logKw. MRE denoted in the graph represents the sample mean value of MRE for training and testing ligands. (n = 45 × 2 = 90).
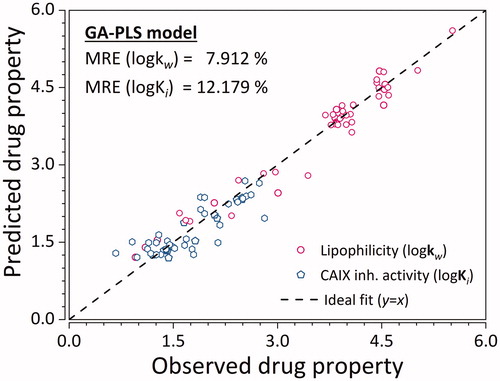
Table 2. Solution of the PLS inversion and its distance to the molecular descriptor values of the reference ligand.
Figure 5. Applicability domain of the GA-PLS QSPR model for logKi. Empty hexagons denote logKi, while empty circles denote logkw. (n = 45 × 2 = 90).
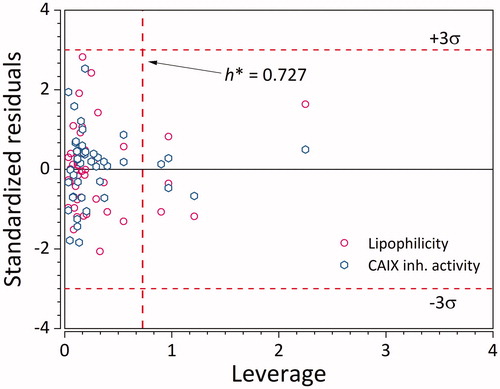
Figure 6. PLS loading plot. Empty squares denote X-, while empty circle and hexagon denote Y-variables. Projections to logKw and logKi lines are denoted using pink and light blue pentagons, respectively.
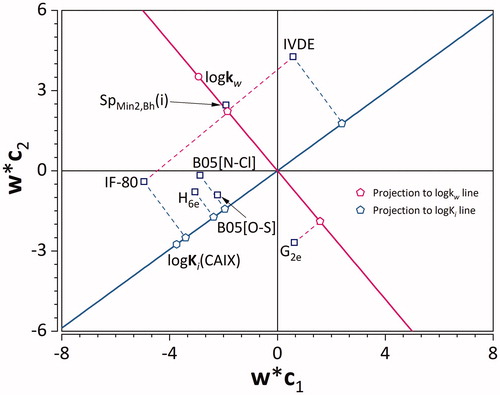
Figure 7. FTIR spectra of recombinant CA IX (control) and its complexes with the ligand C101 in 5 different concentrations.
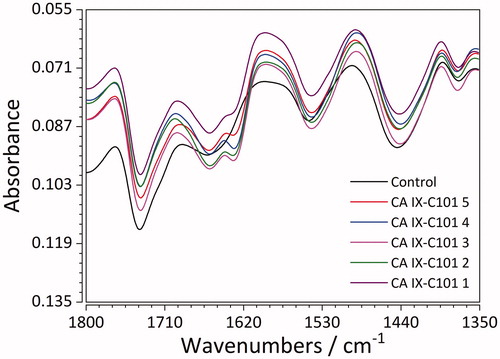
Figure 8. Superposition of binding poses of C75 (orange), C76 (faded teal), and C84 (salmon pink) against CA IX receptor (purple). Yellow dashed lines represent hydrogen bonds.
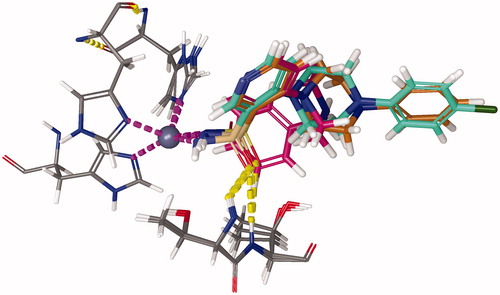
Figure 9. Representative snapshot of the structure of carbonic anhydrase IX (5FL4) in complex with C101 after 500 ns of MD simulation. Protein: green ribbon, zinc: silver sphere, C101: blue carbons, and 3 histidine residues: grey carbons. Magenta dashed lines represent the Zn-N covalent coordination bonds. Yellow dashed bonds represent hydrogen bonds.
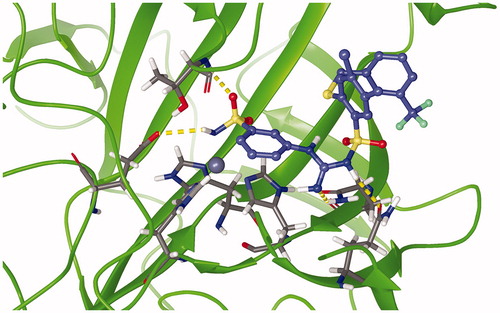
Figure 10. Root mean square fluctuations (RMSF) of studied CA IX complexes with AZM, C75, C76, C89, and C01 ligands. The reference values were calculated based on the crystallographic temperature factor (B-values)Citation63 of PDB structure 5FL4.Citation48 The light blue, pink, and white regions demarcated by the dashed blue and pink vertical lines correspond to β-sheet, α-helix, and loop secondary structures, respectively. The solid blue vertical lines correspond to the residues constituting the zinc prosthetic group: His 94, 96, and 119.
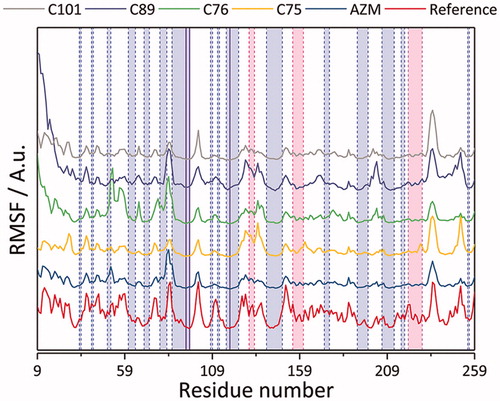
Table 4. Summary of prominent hydrogen bonds formed throughout the 1 μs MD course.