Figures & data
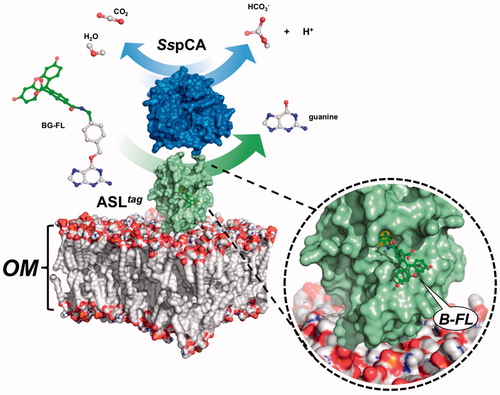
Figure 1. Fluorescence microscopy of E. coli BL21(DE3) cells transformed with pET-22b/INPN-SspCA (left) or with pET-ASLtag-SspCA (right). The cells were incubated with BG-FL and then analysed by fluorescence microscopy. Images show bright field (BHF) and AlexaFluor488 (green). As expected, the fluorescence is only evidenced for the bacterial cell transformed with the ASLtag system.
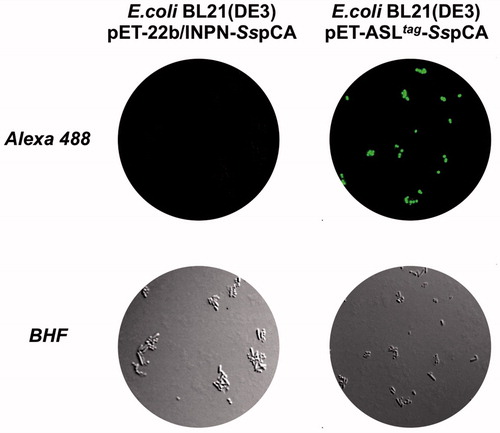
Figure 2. Western Blot performed on the outer membrane purified from the whole bacterial cells. The anti His-tag antibody was raised against the C-terminus of His-tagged SspCA. Legend: Lane Std, molecular markers, M.W. starting from the top: 75.0, 50.0, and 37.0 kDa; Lane 1, anchored SspCA; Lane 2, anchored H5-SspCA.
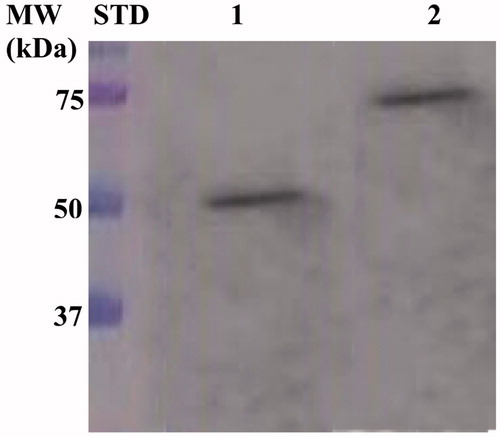
Figure 3. Model representation of an outer membrane fraction (OM; pdb from Tieleman and Berendsen65) describing the in vivo immobilisation of SspCA (in blue; PDB ID: 4G7A; panel A) and in fusion with H5 (in green; PDB ID: 6GA0; panel B). The INPN domain is omitted because inserted in the OM. The catalytic reaction of SspCA (the hydration/dehydration of CO2) and H5 (the conversion of BG-FL in the free guanine and the fluorescent benzyl-guanine derivative, B-FL, covalently linked to the active site of H5) are also shown.
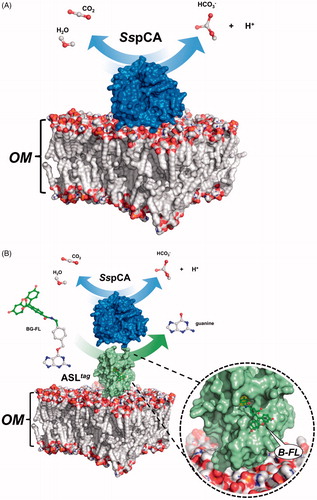
Figure 4. Protonography (Panel A), fluorescence gel-imaging (Panel B) and Coomassie staining (Panel C) of SspCA and H5-SspCA carried out with different amounts of the whole E. coli cells (see Materials and Methods). Filled green, white and black arrows represent the ASLtag-SspCA, INPN-SspCA and the free SspCA, respectively.
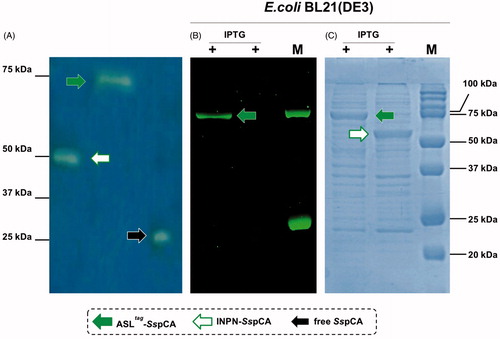
Figure 5. The thermostability of immobilised SspCA and H5-SspCA on the bacterial surface. Measures were carried out at indicated temperatures, by using aliquots of the whole cells incubated up to 24 h. Legend: continuous line, membrane-bound H5-SspCA; dashed line, membrane-bound SspCA. Each point is the mean of three independent determinations.
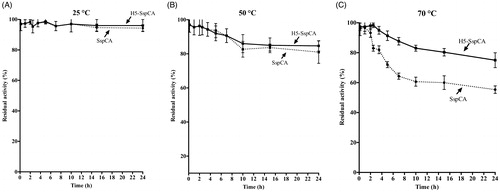
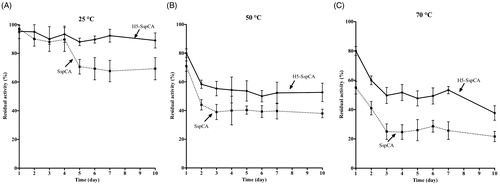
Figure 6. The long-term stability of immobilised SspCA and H5-SspCA on the bacterial surface. Measures were carried out at indicated temperatures up to 10 d, using aliquots of whole bacterial cells. Continuous line: free SspCA; Dashed line: membrane-bound SspCA. Each point is the mean of three independent determinations.