Figures & data
Figure 1. The structures of curcumin and some reported BAPs.
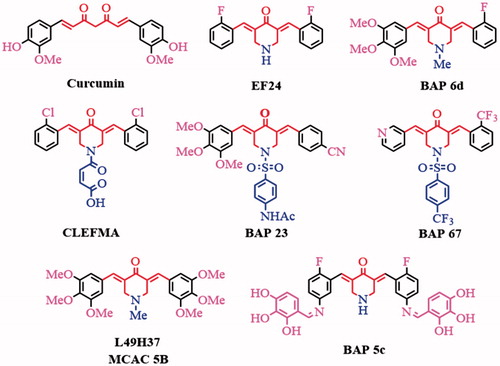
Table 1. Cytotoxicity of BAPs, Curcumin, and DOX.
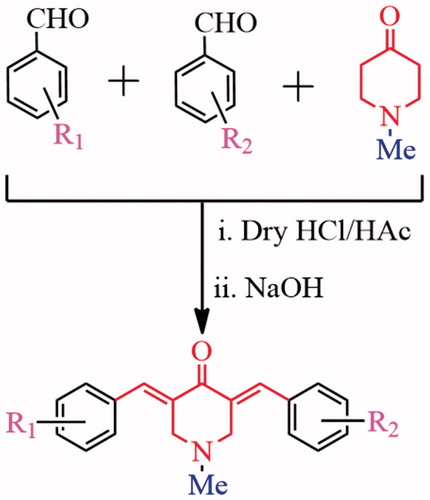
Scheme 1. Synthetic strategy of BAPs 83–91.
Scheme 2. Synthetic strategy of BAPs 93–102.
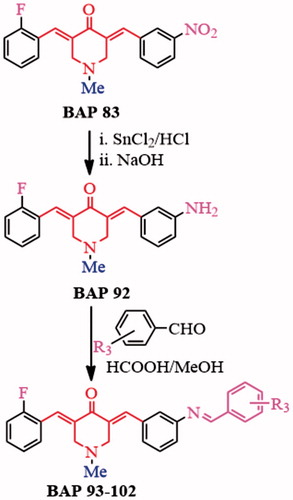
Figure 2. (A) The cytotoxicity of all BAPs against RAW264.7 cells by MTT assay in vitro. (B) The levels of TNF-α induced by LPS stimulation in RAW 264.7 cells through ELISA analysis. PDTC was used as a positive control. The results were presented as the percent of LPS control. Each bar represents the mean ± SD of three independent experiments. Statistical significance relative to the LPS group is indicated: ∗p < 0.05; ∗∗p < 0.01.
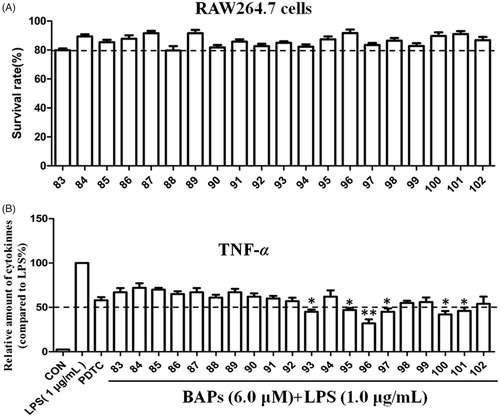
Figure 3. (A) The structures of 96. (B) 96 induces HepG2 cells apoptosis. **p < 0.01, ***p < 0.001 versus the negative control. (C) The effect of 96 on the expression of Bax, Bcl-2, and C-caspase-3 detected by western blot. The data are representative of three independent experiments. *p < 0.05, **p < 0.01, ***p < 0.001 versus the negative control (one-way ANOVA followed by Dunnett’s test).
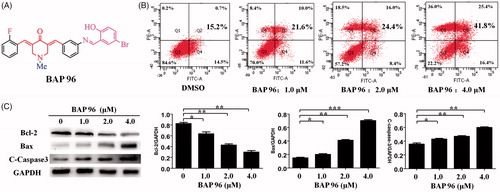
Figure 4. (A–D) Inhibitory effects of 96 on LPS-stimulated phosphorylation of IκBα (A) and p65 (B) in RAW264.7 cells and TNF-α-stimulated phosphorylation of IκBα (C) and p65 (D) in HepG2 cells, respectively. Data represent as the mean ± SD of triplicate tests. *p < 0.05, **p < 0.01 compared with the LPS or TNF-α alone group. (E, F) Effects of 96 on the nuclear translocation of NF-κB p65 protein in the LPS-stimulated RAW264.7 cells (E) or TNF-α-stimulated HepG2 cells (F) by immunofluorescence assay. These experiments were repeated three times with similar results.
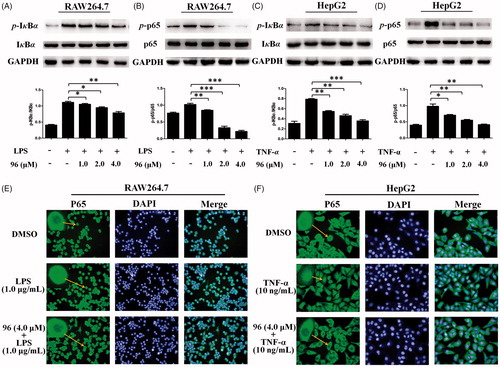
Figure 5. (A, B) 3D model and 2D model of the interaction between simulated 96 and the active site of Bcl-2 protein. (C, D) 3D model and 2D model of the interaction between simulated 96 with the active site of NF-κB p65.
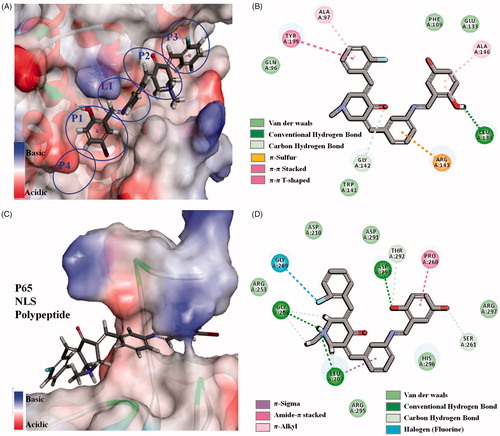
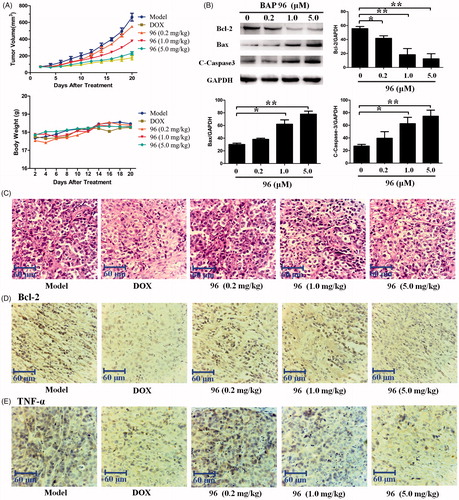
Figure 6. The inhibitory effects of BAP 96 on inhibiting HepG2 xenografts growth in vivo. (A) The HepG2 xenografts growth curves very two days and mice body weight curves every 2 d. (B) The expression of Bcl-2, Bax, and C-caspase-3 in the HepG2 xenografts of five groups. (C) The morphology of the HepG2 xenografts of the five groups detected by HE staining. (D) The expression of Bcl-2 and (E) the expression of TNF-α in the HepG2 xenografts of the five groups investigated by immunohistochemistry staining. Scale bar = 60 μm (C, D, E).