
Figures & data
Figure 1. Major route steps to obtain 2,4-diaminopyrimidine derivatives 1–5. Chemical structures are shown in the lower panel.
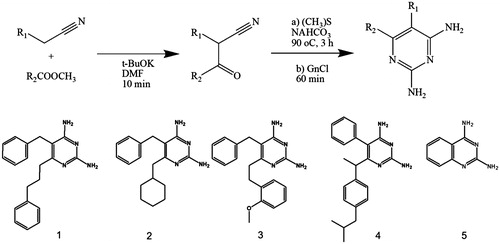
Figure 2. Cloning, expression, purification, and kinetic characterization results for LcPTR1. (A) Cloning steps to insert LcPTR1 gene into pETM11 expression vector monitored by 1% agarose gel. A1: (1) Marker 1 kb DNA Ladder, A1: (2) PCR amplification product with base pairs (bp) equivalent to LcPTR1 gene; A2: (1) Tridye 100pb ladder (NEB); A2: (2) Product of PCR reaction employing E. coli CFU resulting from the transformation protocol. (B) Expression and purification of LcPTR1. SDS/page 12%. (B1) Protein expression profile of LcPTR1 in E. coli BL21 (DE3). After expression induction at 25 °C (18 h), in the presence of different IPTG concentrations (0.05, 0.5, and 1.0 mM). NI: the absence of IPTG; P: pellet: S: supernatant; MM: LMW-SDS GE molecular weight standard (kDa). B2: (1) molecular weight standard (kDa); (2) purification supernatant; (3) fraction 20 mM imidazole; (4–6) 50 mM imidazole; (7–9) 500 mM imidazole. (10) LcPTR1 after cleavage. (C) Activity of LcPTR1 in different pH ranges. Values represent median and interquartile range of % activity when compared to the highest median of activity obtained, at pH 4, 7 (N = 3). (D) Apparent Km determination for recombinant LcPTR1.
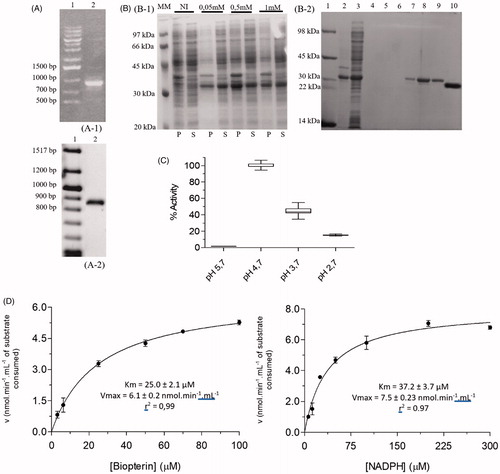
Figure 3. Cloning, expression, purification and kinetic characterization results for LcDHFR-TS. (A) Cloning steps of the LcDHFR-TS gene in the pET28a vector, monitored by 1% agarose gel. A1, A2: (1) Marker 1 kb DNA Ladder; A1: (2) Product of the amplification reaction of the LcDHFR-TS gene from the genomic DNA; A2: (2) Product of PCR reaction with primer T7 employing CFU from the transformation protocol. (B) Expression and purification of LcDHFR-TS. Gel SDS-page 12%. (1) Molecular weight standard; (2–3) insoluble and soluble fraction of the lysate; (4–5) contaminants eluted in low imidazole concentration; (6–7) Wash with buffer containing 500 mM imidazole; (8–10) Column eluate with imidazole-free buffer after application of the dialyzed material and incubated with thrombin. (C) Activity of LcDHFR-TS in different pH ranges. Values represent median and interquartile range of % activity when compared to the highest median of activity obtained, at pH 7.0 (N = 3). (D) Apparent Km determination for LcDHFR-TS.
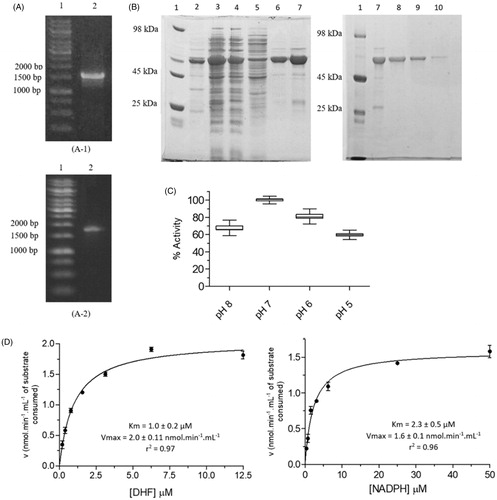
Figure 4. Kinetic inhibition assays results for LcPTR1. (A) Single concentration (50 μM) inhibition assay. (B) Dose-response curves for compounds 1–5 against LcPTR1. IC50 values calculated by non-linear regression in GraphPad Prism® 5.0 software. (C) Effect of compound 1 over NADPH and BPT kinetic constants (Kmapp and Vmaxapp). *Statistical difference of results were considered when p < .05 (Kruskal–Wallis ANOVA). (D) Effect of compound 5 over NADPH and BPT kinetic constants (Kmapp and Vmaxapp) *Statistical difference of results were considered when p < .05 (Kruskal–Wallis ANOVA).
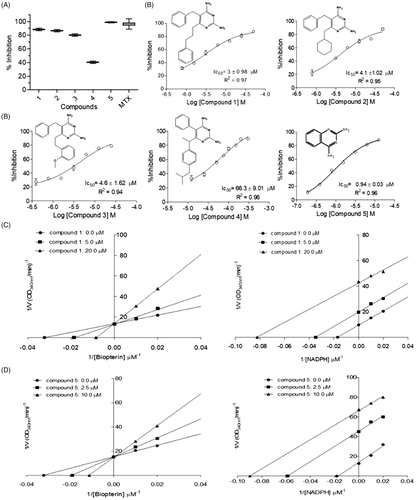
Figure 5. Kinetic inhibition assays results for LcDHFR-TS. (A) Inhibition profile against in 50 μM inhibitor single concentration assay. (B) Dose-response curves for compounds 1–3 against LcDHFR-TS. IC50 values calculated by non-linear regression in GraphPad Prism® 5.0 software. (C) Effect of compound 1 over NADPH and DHF kinetic constants (Kmapp and Vmaxapp). *Statistical difference of results were considered when p < .05 (Kruskal–Wallis ANOVA).
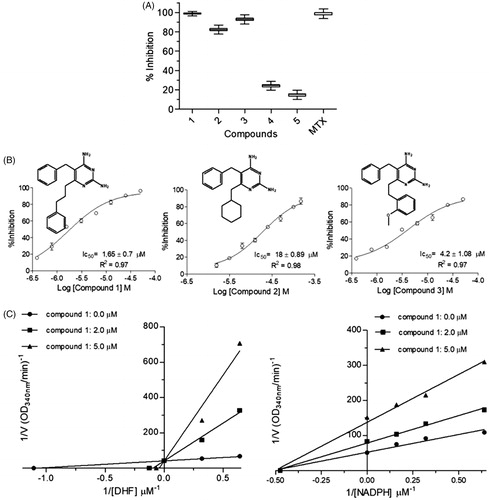
Table 1. Selectivity ratio for the 2,4-diaminopyrimidine derivates active against LcDHFR-TS and LcPTR1.