
Figures & data
Table 1. 1H NMR and 13C NMR Spectroscopic Data for Compound 11 (CDCl3, δ in ppm).
Figure 1. Structures of the isolated coumarins.
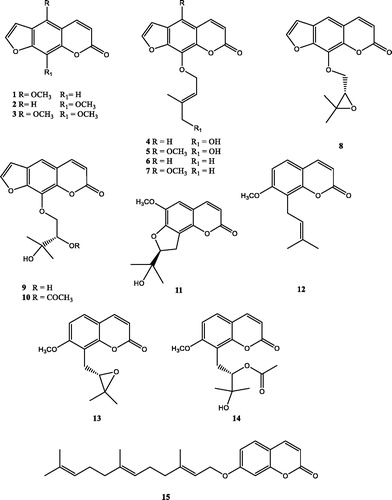
Table 2. Inhibition data towards hCA I, II, IX, and XII of compounds 1–15.
Figure 2. Main HMBC correlations of compound 11.
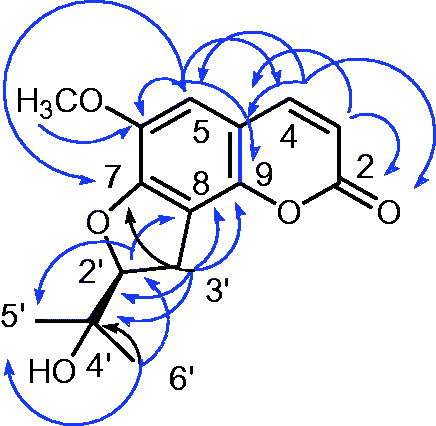
Figure 3. ECD (left) and UV (right) spectra of compound 11.
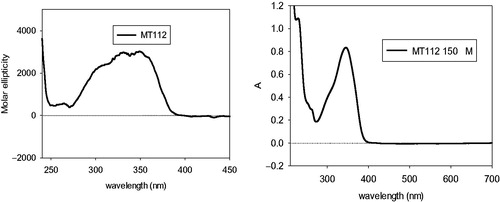
Figure 4. 3D representation of the putative binding mode obtained by docking experiments. (a,b) CA -XII-15 (c,d) CA -XII-11, (e,f) CA -XII-9 and the relative 2D representation of the complexes stabilising interactions with the binding site residues represented with different colour depending on their chemical-physical properties: green, hydrophobic; cyan, polar; violet, positive; red, negative charged residues; grey, metal atoms. Instead, magenta arrows indicate the formation of hydrogen bond between protein and ligand, while grey lines indicate the interaction with the complexed ion.
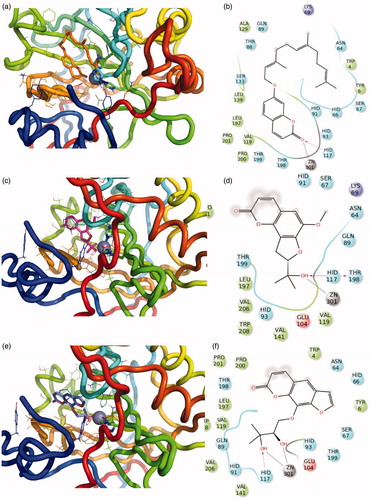
Figure 5. 3D representation of the putative binding mode obtained by docking experiments. (a,b) CA -XII-15-openE (c,d) CA -XII-15-openZ and the relative 2D representation of the complexes stabilising interactions with the binding site residues, with the colour scheme indicated above.
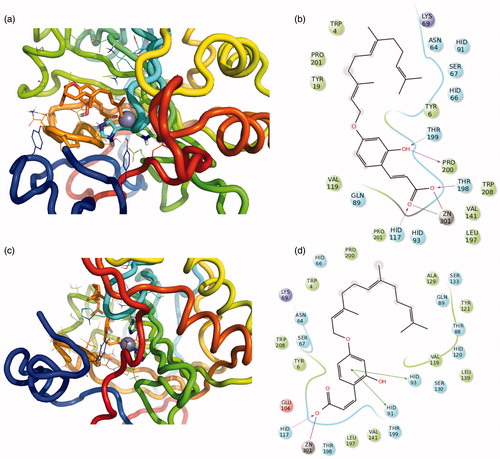
Table 3. Cytotoxic effect of compounds 5, 9–12 and 15 evaluated towards cancer HeLa cells.