Figures & data
Figure 1. Microalgal endogenous activity revealed by the protonography analysis. Legend: Lane 1, molecular markers; Lane 2, C. sorokiniana cellular extract; Lane 3, commercial bovine CA used as positive controls. The arrows identified the yellow bands corresponding to CO2 hydratase activity due to the microalgal CAs.
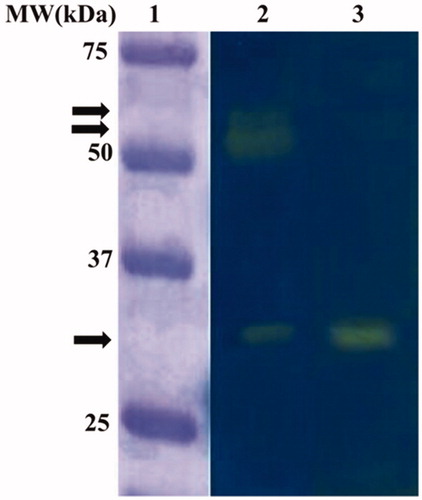
Figure 2. Cellular density (cells mL−1) in control and experimental cultures (Bic, M-SspCA-0, M-SspCA-2) of Chlorella sorokiniana. Error bars represent SD (n = 3).
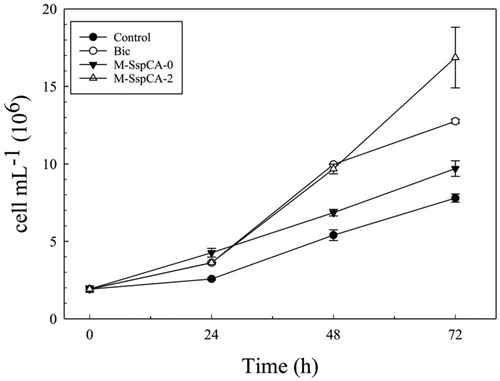
Figure 3. Average cell diameter of C. sorokiniana cells in control and experimental cultures (Bic, M-SspCA-0, M-SspCA-2). Error bars represent SD (n = 3).
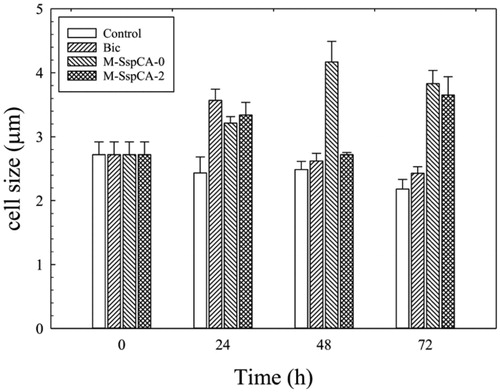
Figure 4. Maximum quantum yield (Fv/Fm) in Chlorella sorokiniana control and experimental cultures (Bic, M-SspCA-0, M-SspCA-2). Error bars represent SD (n = 3).
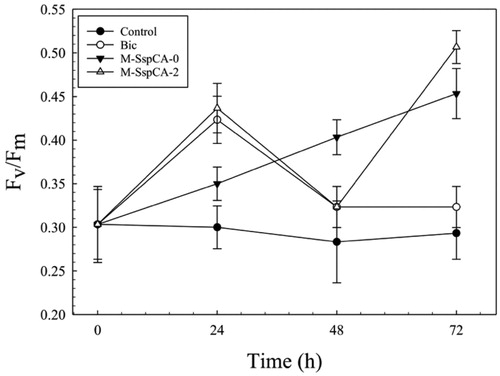
Figure 5. Total chlorophyll content in control C. sorokiniana cells and experimental cultures (Bic, M-SspCA-0, M-SspCA-2). Error bars represent SD (n = 3).
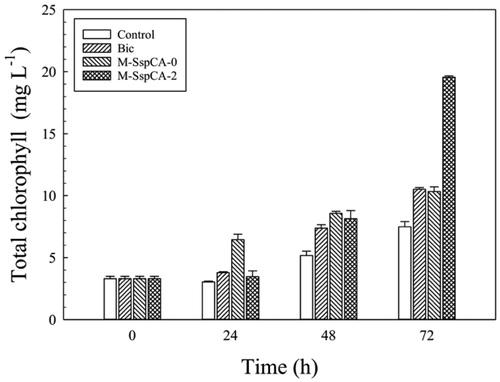
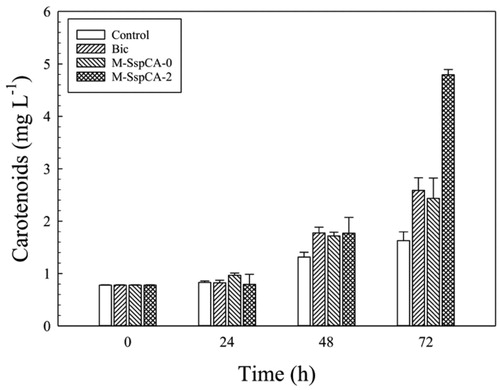
Figure 6. Total carotenoids content in control C. sorokiniana cells and experimental cultures (Bic, M-SspCA-0, M-SspCA-2). Error bars represent SD (n = 3).