Figures & data
Figure 1. CDR structures of the VEGF nanobody obtained from I-TASSER. (a) CDR1 structure. (b) CDR2 structure. (c) CDR3 structure. (d) CDR1,3 structure. (e) CDR1,2 structure.
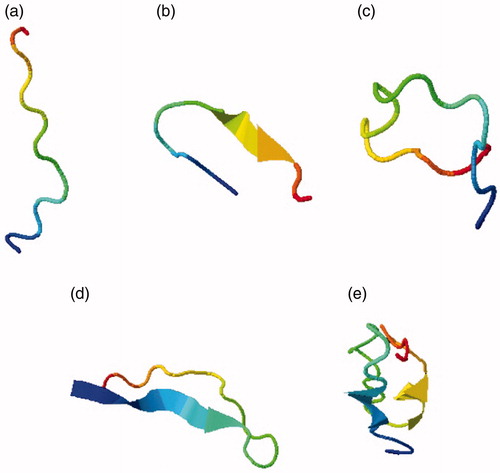
Table 1. Results of computer-based energy minimizations on CDRs.
Table 2. Amino acid sequences of nanobody CDRs submitted to I-TASSER.
Table 3. Results on docking simulation experiments of CDR regions and VEGF nanobody.
Figure 2. (a) SDS-PAGE of the purified nanobody. (b) Western blotting of the purified nanobody. M; protein marker, 1; the extracted nanobody 2; wash flow through.
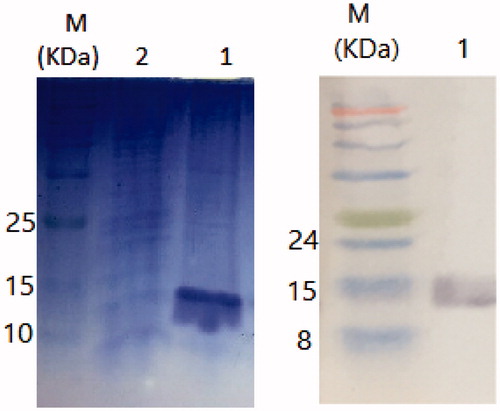
Figure 3. MTT assay results. (a) The effects of nanobody and peptide on the growth of HUVEC cells after 24 h and (b) 48 h. Determined IC50s(24 h) were 200, 300, and 350 nM for bevacizamab, nanobody, and peptide, respectively. Moreover, calculated IC50s(48 h) were 150, 170, and 200 nM for bevacizamab, nanobody, and peptide, respectively. Data are presented as mean ± SD. *p value s= .0292, **p values = .001.
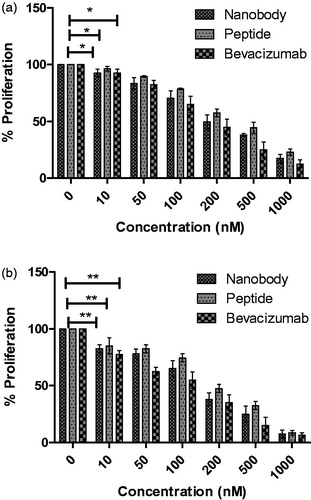
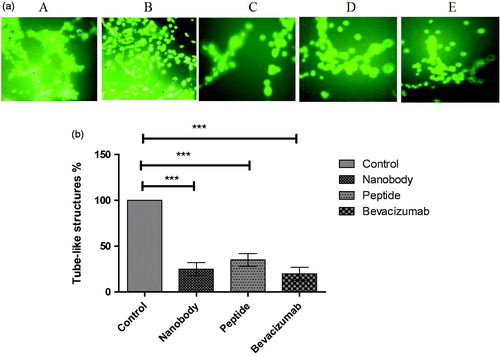
Figure 4. Tube assay results. (a) Tube like structures: A; HUVEC cells with VEGF, B; without VEGF, C; Nanobody, D; Peptide, E; Bevacizumab. (b) Quantification of tube assay results. Control; HUVEC cells in the presence of VEGF and without any inhibitory factors formed complete tube-like structures. HUVEC cells in the presence of nanobody, peptide, and Bevacizumab formed 25, 35, and 20% of tube-like structures, respectively. Data are presented as mean ± SD. ***; p values = .0001.