Figures & data
Figure 1. Some reported pyrazole hybrid molecules as antimicrobial agents.
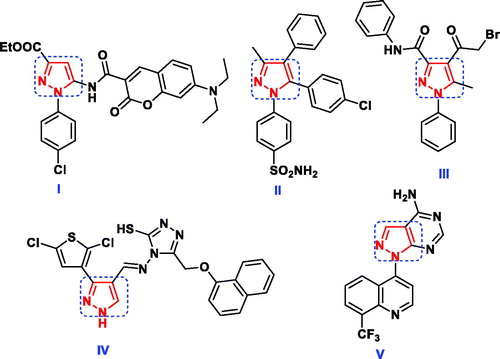
Figure 2. Potent DHFR inhibitors owning pyrazole scaffold as antimicrobial and antimalarial agents.
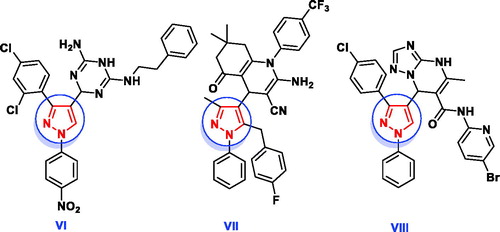
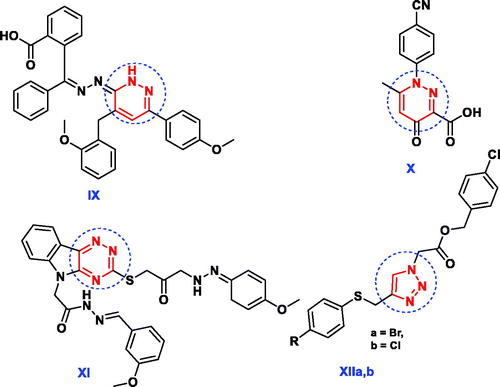
Figure 3. Reported antimicrobial leads containing pyridazine, 1,2,4-triazine and 1,2,3-triazole moieties.
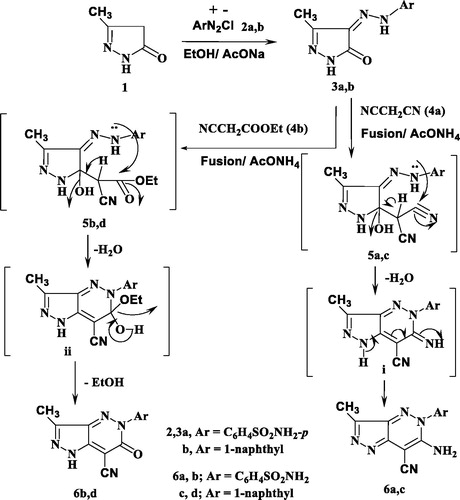
Scheme 1. Synthesis of pyrazolopyridazine derivatives.
Scheme 2. Synthesis of pyrazolotriazine and pyrazolotriazole derivatives.
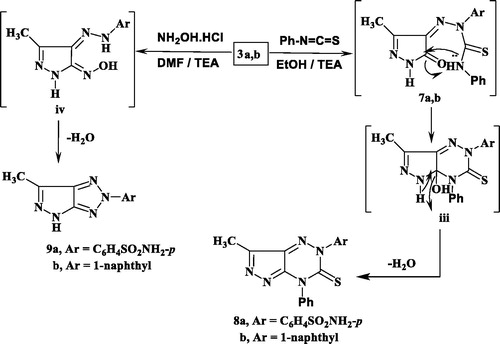
Figure 4. Antimicrobial activity of the most active compounds against different bacterial and fungal strains compared with the reference drugs, ciprofloxacin and amphotericin B, respectively.
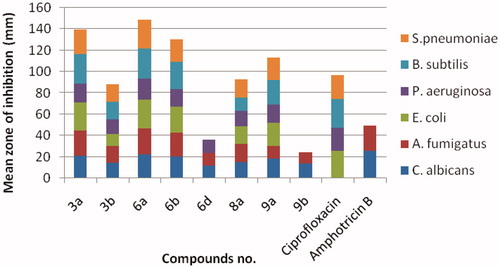
Table 1. Minimal inhibitory concentrations (MICs) of the synthesised compounds against the tested pathogenic bacteria and fungi.a
Table 2. In vitro inhibitory activities of the screened compounds 3a, 3b, 6a, 6b, 8a and 9a against DHFR enzyme.
Table 3. Calculated molecular properties of the synthesised compounds 3, 6, 8 and 9 for assessment of the drug likeness.
Table 4. Toxicity risks, solubility, drug-likeness, and drug score of the synthesised compounds.
Figure 5. 2D and 3D Views (A, B) of the original ligand, methotrexate re-docked in the active site of DHFR (PDB ID: 1DLS) using MOE software. 3D representation (C) of the superimposition of the docking pose (yellow) and the co-crystallised (red) of methotrexate with an RMSD of 0.88 Å.
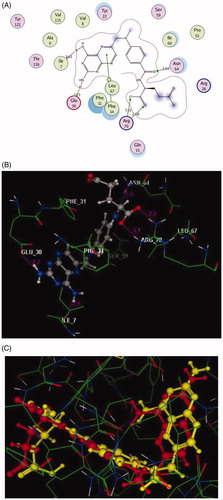
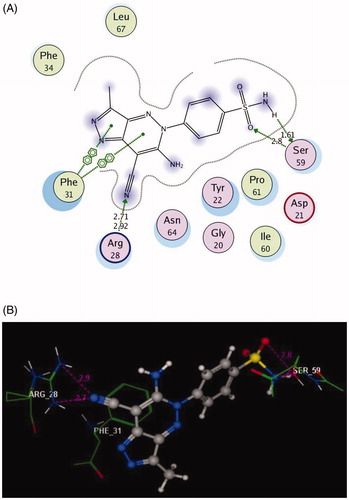
Figure 6. 2D and 3D Views (A, B) of the compound 3a docked in the active site of DHFR (PDB ID: 1DLS) using MOE software. Dotted lines and arrows represent hydrogen bonds.
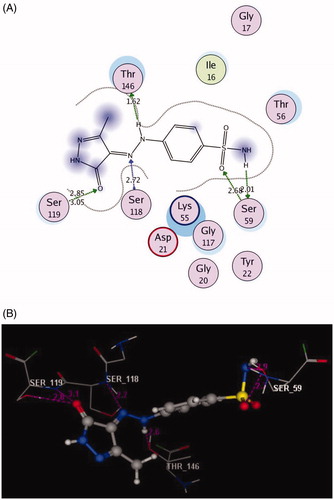
Figure 7. 2D and 3D Views (A, B) of the compound 6a docked in the active site of DHFR (PDB ID: 1DLS) using MOE software. Dotted lines and arrows represent hydrogen bonds.