Figures & data
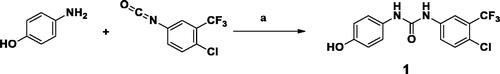
Scheme 1. Preparation of diaryl urea derivative: Reagents and conditions: (a) 1,4-dioxane, room temperature, 1 h, 75%.
Scheme 2. Preparation of KM6: Reagents and conditions: (a) S, piperidine, water bath at 50–60 °C, 16 h,70% (b) HCONH2, reflux, 3 h, 81% (c) POCl3, reflux, 3 h, 76% (d) Acetonitrile, urea derivative (1), Cs2CO3, 60 °C, 6 h, 66%.
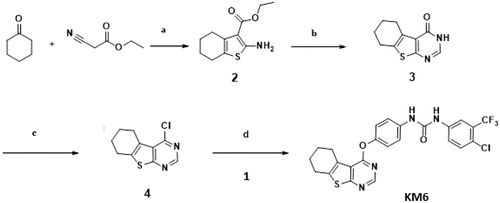
Figure 1. Cytotoxicity of TAM and KM6 on BC cell lines: (A, B) Effect of TAM on MCF7 and LCC2, respectively. (C, D) Effect of KM6 on MCF7 and LCC2, respectively, by sulphorhodamine assay. Graphs and data analysis were performed using GraphPad InStat, version 5. The data represent means of at least three independent experiments ± SD. aSignificantly different from control (P < 0.05).
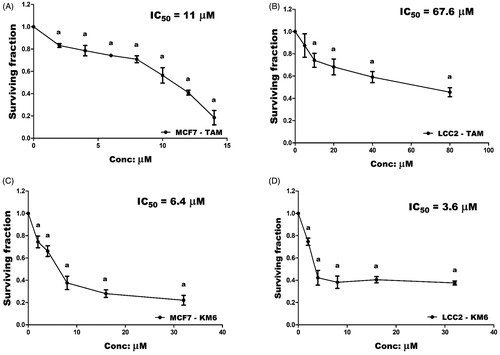
Figure 2. (A) 2D interaction diagram of sorafenib co-crystallized with VEGFR-2 showing two hydrogen bonding with Cys919 (PDB ID: 4ASD) (B) Docking pose of KM6 into VEGFR-2 kinase enzyme. (C) Effect of TAM and KM6 on VEGF level in MCF7 and LCC2. Statistical significance of results was analysed using one-way ANOVA followed by Tukey’s multiple comparison test. aSignificantly different from control, b from TAM and (p < 0.05). TAM was used at IC 50 (11 µM for MCF7 and 67.6 µM for LCC2). KM6 was used at IC 50 (6.4 µM MCF7 and 3.6 µM for LCC2).
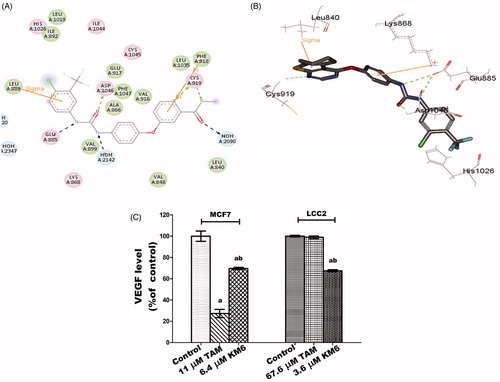
Figure 3. Effect of TAM and KM6 on Ki-67 mRNA expression in MCF7 and LCC2 by real time RT-PCR. Statistical significance of results was analysed using one-way ANOVA followed by Tukey’s multiple comparison test. aSignificantly different from control, b from TAM and (p < 0.05). TAM was used at IC50 (11 µM for MCF7 and 67.6 µM for LCC2). KM6 was used at IC50 (6.4 µM MCF7 and 3.6 µM for LCC2).
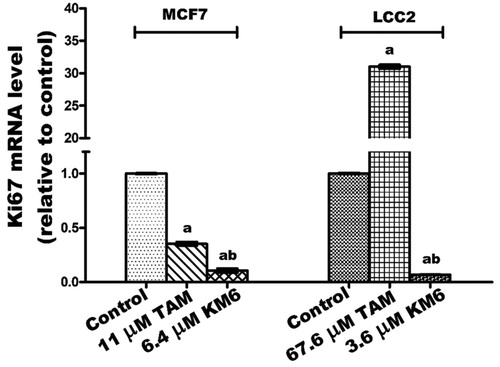
Figure 4. Effect of TAM and KM6 on oxidative stress markers (A) MDA, (B) NO, (C) SOD and (D) GSH in MCF7 and LCC2. Statistical significance of results was analysed using one-way ANOVA followed by Tukey’s multiple comparison test. aSignificantly different from control, b from TAM and (p < 0.05). TAM was used at IC 50 (11 µM for MCF7 and 67.6 µM for LCC2). KM6 was used at IC 50 (6.4 µM MCF7 and 3.6 µM for LCC2).
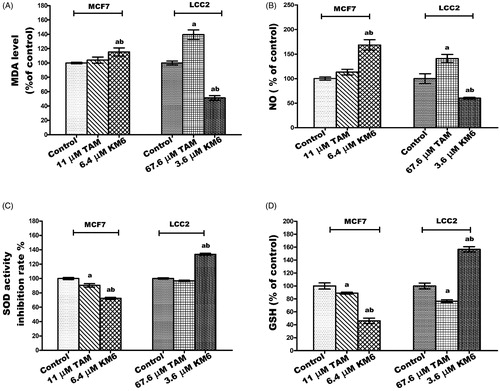
Figure 6. Effect of TAM and KM6 on glucose metabolism in MCF7 and LCC2. (A) Glucose uptake in media. (B): LDH level in cell lysate. (C) AKT mRNA expression. Statistical significance of results was analysed using one-way ANOVA followed by Tukey’s multiple comparison test. aSignificantly different from control, bfrom TAM and (p < 0.05). TAM was used at IC 50 (11 µM for MCF7 and 67.6 µM for LCC2). KM6 was used at IC 50 (6.4 µM MCF7 and 3.6 µM for LCC2).
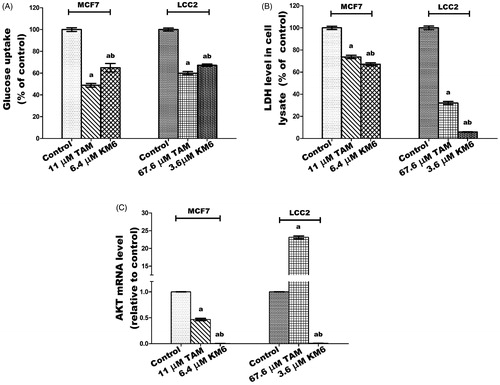
Figure 7. Effect of TAM and KM6 on inflammatory markers: (A) Effect on PGE2 using ELISA. (B–D) Effect on COX-2, IL-β and IL-6 mRNA expression as determined by real time RT-PCR (E) Effect on protein expression of IL-6 as determined by western blotting. Statistical significance of results was analysed using one-way ANOVA followed by Tukey’s multiple comparison test. aSignificantly different from control, bfrom TAM and (p < 0.05). TAM was used at IC 50 (11 µM for MCF7 and 67.6 µM for LCC2). KM6 was used at IC 50 (6.4 µM MCF7 and 3.6 µM for LCC2).
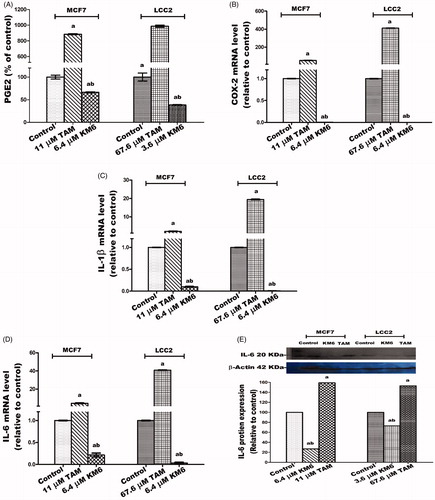
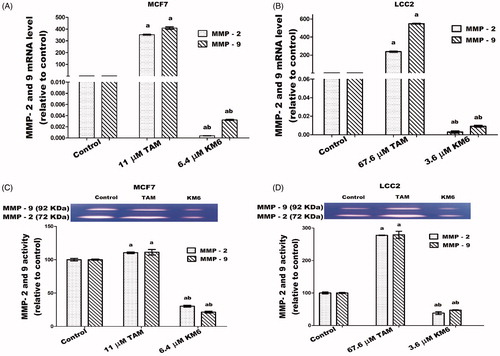
Figure 8. Effects of KM6 and TAM on invasion and metastatic markers in MCF7 and LCC2. MMP-2 and MMP-9 mRNA expression was determined by real time RT-PCR in MCF7 (A), and LCC2 (B). Also, zymographic activity was determined in both cell lines (C, D). The analysis was done by WinImage Studio Lite_5.2.5software. Statistical significance of results was analysed using one-way ANOVA followed by Tukey’s multiple comparison test. aSignificantly different from control, bfrom TAM and (p < 0.05). TAM was used at IC 50 (11 µM for MCF7 and 67.6 µM for LCC2). KM6 was used at IC 50 (6.4 µM MCF7 and 3.6 µM for LCC2).