Figures & data
Scheme 1. Reaction scheme leading to closo and nido clusters substituted by alkylsulfonamide groups, i. HCC-(CH2)n-S(O)2NH2 (n = 5, I; n = 6, II), toluene, reflux, ii. KOH/MeOH, reflux.
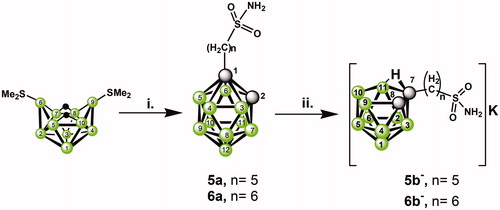
Table 1. In vitro inhibition and X-ray structure overview.
Figure 1. Inhibition and selectivity profiles of compounds 1a to 6a (A) and 1 b− to 6 b− (B). Ki values (in decadic logarithmic scale) for in vitro inhibition are shown in grey for CA II and black for CA IX. Error bars are depicted as standard deviations of a least square statistical analysis of the inhibition curve. The selectivity index shown as a dashed line is the ratio between Ki (CA II) and Ki (CA IX).
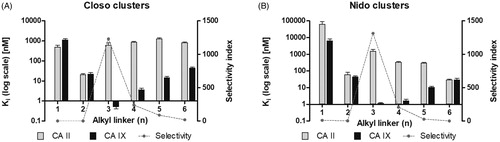
Figure 2. Compounds bound to the active site of CA IX-mimic (A) and CA II (B). 2Fo-Fc map contoured at 1σ is shown with the exception of 4 b−, 5a, 6a, and 6 b− bound to CA II that are contoured at 0.5 σ. (A) Compound 5a was modelled in two alternative conformations with partial occupancies of 0.5 and 0.5. All other compounds were modelled in one conformation with full occupancy. *Crystal structures of 3a and 3 b− in complex with CA IX-mimic, published previouslyCitation35, are shown for comparison. (B) Compound 3a was modelled in two alternative conformations with partial occupancies of 0.8 and 0.2. Compound 4 b− was modelled in three alternative conformations with partial occupancies of 0.3, 0.3, and 0.3. Compounds 4a, 5a, and 6 b− were modelled in two alternative conformations with partial occupancies of 0.5 and 0.5. All other compounds were modelled in one conformation with full occupancy.
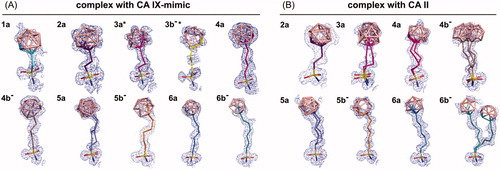
Figure 3. Overview of binding of selected compounds in the active site of CA IX-mimic (A) and CA II (B). The protein surface is represented by its solvent accessible surface coloured by electrostatic potential (red for negative, blue for positive). Compounds are shown as lines with differently coloured carbon atoms: 1a (cyan), 2a (purple), 3a (light magenta), 3 b− (yellow), 4a (hot pink), 4 b− (brown), 5a (slate), 5 b− (orange), 6a (marine), and 6 b− (deep teal). Boron atoms are coloured pink; oxygen, sulfur, and nitrogen are shown in red, yellow, and blue, respectively. Hydrophobic and hydrophilic residues are labelled in black and white, respectively. Residues that vary between CA IX-mimic and CA II are underlined. For clarity, residues H94, H96, H119, V143, and T199 at the bottom of the cavity are not labelled. The zinc ion is represented by the grey sphere.
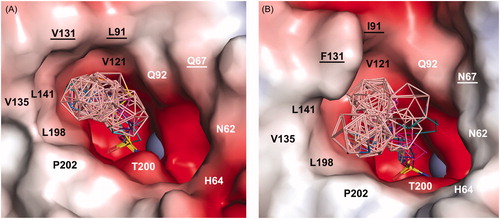
Figure 4. The structures of compounds bound to the CA IX-mimic cavity (A) and CA II (B). Structures with 1a and 3 b− in complex with CA II were not determined. The compounds are depicted in stick representation with differently coloured carbon atoms: 1a (cyan), 2a (purple), 3a (light magenta), 3 b− (yellow), 4a (hot pink), 4 b− (brown), 5a (slate), 5 b− (orange), 6a (marine), and 6 b− (deep teal). Boron atoms are coloured pink; oxygen, sulfur, and nitrogen are shown in red, yellow, and blue, respectively. Protein cavity is shown as a grey surface, zinc ion is represented by the grey sphere. Only residues H64, H96, H119, V131, and L141 forming part of active site cavity are highlighted as sticks; other residues are omitted for clarity. All contacts with distance between the ligand and protein atoms less than or equal to 4 Å are listed for each compound. The first number in parentheses represents the number of contacts with the compound’s linker and the sulfonamide moiety, while the second number represents the number of contacts with the carborane cluster. The residues highlighted in bold represent conserved residues (H94, H96, H119) involved in zinc ion coordination.
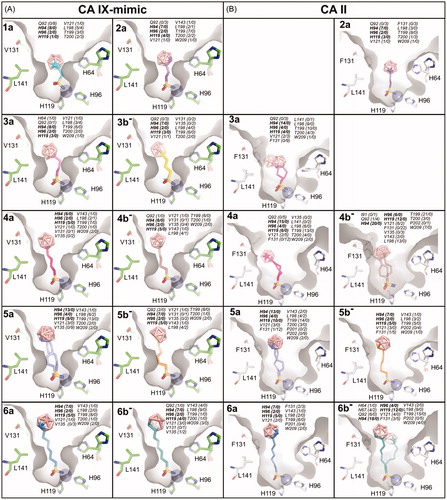
Figure 5. The different binding positions of compounds between the CA IX-mimic and CA II active sites. The structures of compounds are depicted as sticks with differently coloured carbon atoms: 2a (purple) and 3a (light magenta). Boron atoms are coloured pink; oxygen, sulfur, and nitrogen are shown in red, yellow, and blue, respectively. Carbon atoms in CA IX-mimic and CA II are shown in green and white, respectively. Protein is represented as cartoon with the residues interacting with compounds highlighted as sticks. The zinc ion is shown as the grey sphere. Polar contacts between protein and compound are labelled as black dashed lines, and coordination bonds are marked as red dashed lines. The numbers in parentheses give the number of contacts with a distance between the ligand and protein atoms less than or equal to 4 Å. The numbers are separated by a slash to express the number of contacts for each alternative conformation. The active site residues that differ between CA IX-mimic and CA II are highlighted in red.
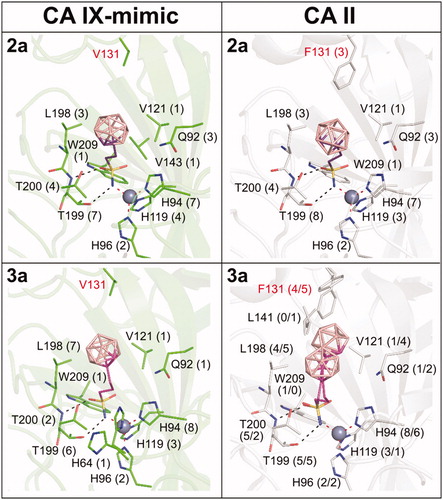
Table 2. Analysis of cluster interaction with the CA active siteTable Footnotea.
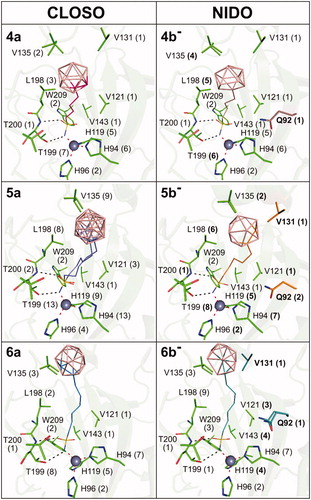
Figure 6. Binding positions of compounds containing the closo and nido cluster, respectively, in the CA IX-mimic active site. The compounds are depicted in lines with carbon atoms coloured differently: 4a (hot pink), 4 b− (brown), 5a (slate), 5 b− (orange), 6a (marine), and 6 b− (deep teal). Protein is shown in green cartoon representation and interacting residues are highlighted as sticks. The zinc ion is represented by the grey sphere. Polar contacts are represented as black dashed lines, and coordination bonds are marked as red dashed lines. The numbers in parentheses give the number of contacts with a distance between the ligand and protein atoms less than or equal to 4 Å. Changes in interaction between the corresponding closo (a) and nido (b−) cluster-containing compounds are in bold, and additional interacting residues are highlighted by carbon colour corresponding to the one of the interacting compound.