Figures & data
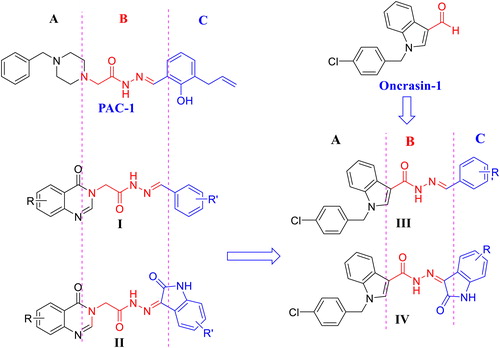
Figure 1. Structure of PAC-1, oncrasin-1, acetohydrazides I, II and rational design of novel (E)-N'-arylidene-1-(4-chlorobenzyl)-1H-indol-3-carbohydrazides III and (Z)-1-(4-chlorobenzyl)-N'-(2-oxoindolin-3-ylidene)-1H-indole-3-carbohydrazides IV.
Scheme 1. Synthesis of novel N'-substituted-1-(4-chlorobenzyl)-1H-indol-3-carbohydrazides (4a–m, 5a–g).
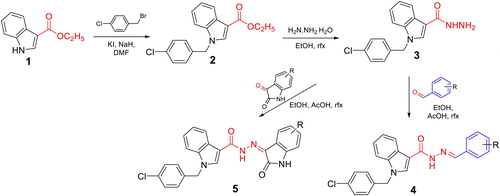
Table 1. Cytotoxicity of the selected compounds against some human cancer cell lines. 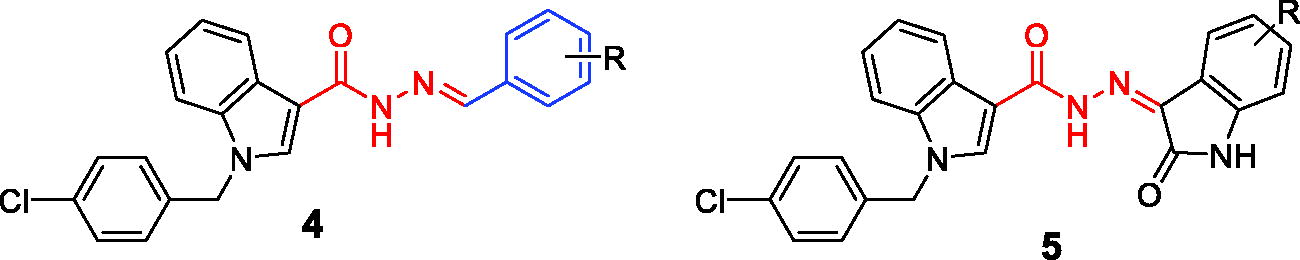
Figure 2. Caspase-3 activation activity of compounds 4a–k. U937 5 × 10⁵ cells/well seeding (2.5 × 10⁵ cells/ml, 2 ml/well, six well) were treated with PAC-1 or compounds (50 µM) for 24 h. Cell lysate was used to detect caspase-3 activation by caspase-3 assay kit. UN: untreated; VH: vehicle (DMSO 0.05%).
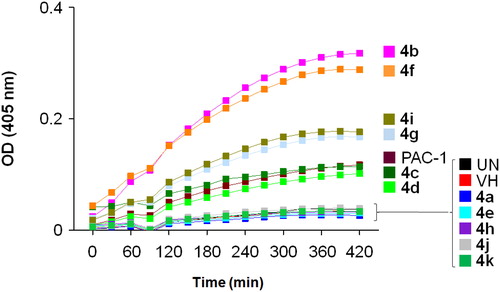
Figure 3. Relative caspase activation activity of some compounds in comparison to PAC-1. Compounds were tested at 50 µM.
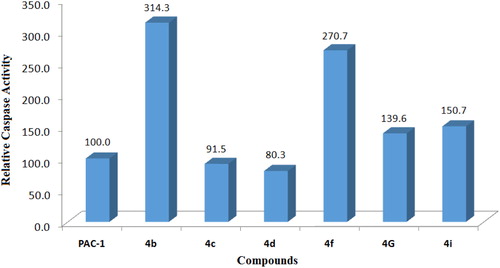
Figure 4. Cell cycle analysis of some compounds. U937 5 × 10⁵ cells/well seeding (2.5 × 10⁵ cells/ml, 2 ml/well, six well) were treated with compounds (50 µM) for 24 h. The harvested cells were stained with propidium iodide (PI) in the presence of RNase and then were analysed for DNA content. UN: untreated; VH: vehicle (DMSO. 0.05%). Data were represented as histograms (left) and bar graphs (right).
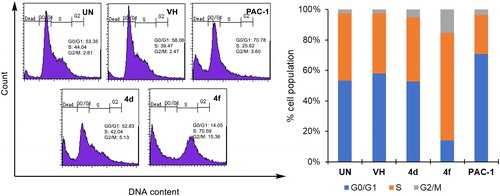
Figure 5. Apoptosis (Annexin V/PI) analysis of some compounds. U937 5 × 10⁵ cells/well seeding (2.5 × 10⁵ cells/ml, 2 ml/well, six well) were treated with compounds (50 µM) for 24 h. The harvested cells were incubated with Annexin V-FITC and PI. UN: untreated; VH: vehicle (DMSO. 0.05%). Area 1 = PI positive population, area 2: Annexin V-positive population. Data were represented as histograms (left) and bar graphs (right).
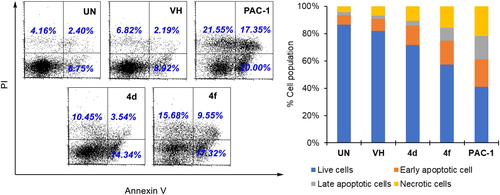
Figure 6. Morphology changes of cells treated with representative compounds 4d and 4f. U937 5 × 10⁵ cells/well seeding (2.5 × 10⁵ cells/ml, 2 ml/well, six well) were incubated for 24 h, then compounds 4a, 4f or PAC-1 (50 μM) were added and incubated further for 24 h. The cells were then photographed using an Imaging Device: Zeiss, Celldiscoverer7 with ×40 lens, scale bar: 20 µm (A) and 50 µm (B). UN: untreated.
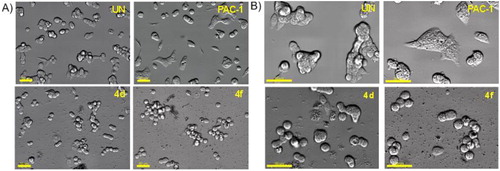
Figure 7. (A) Tetrahedral geometry of Lys36, Glu244, His287 and water molecule with zinc ion; (B) 3D structure of docked complex between PAC-1 and zinc ion in the allosteric binding site of caspase-6 (PDB ID: 4FXO); (C) tetrahedral geometry of the corresponding complex.
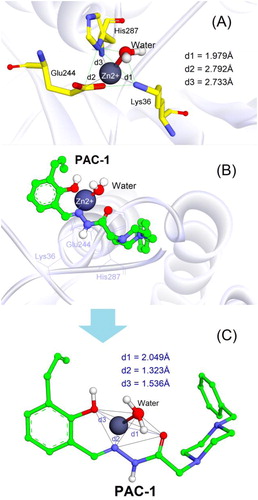
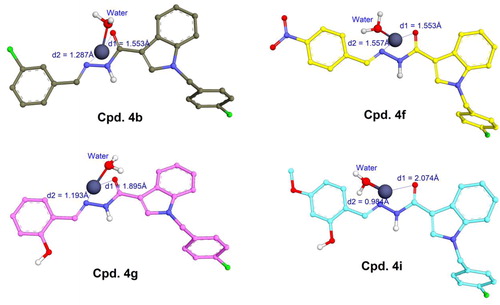
Figure 8. Metal complex and geometries between 4b, 4f, 4g, and 4i with zinc (grey spheres) extracted from locked caspase-6 (PDB ID: 4FXO).