Figures & data
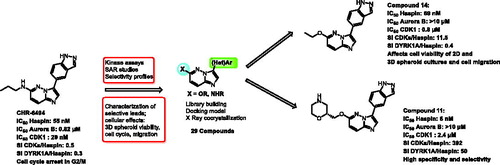
Figure 1. Example of Haspin inhibitors.
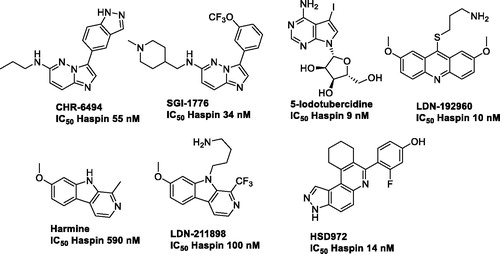
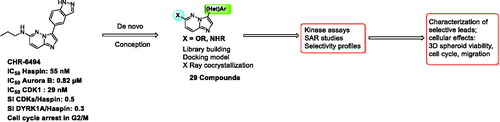
Figure 2. Presented work.
Scheme 1. Reagents and conditions: i) HNRR' (5.0 equiv.), NMP, M.W., 180 °C, 1 h; ii) NBS (1.0 equiv.), ACN, r.t. 1 h; iii) ArB(OH)2 or ArB(Pin)2, Na2CO3, Pd(PPh3)4 (0.1 equiv.), Dioxane/H2O (9/1), M.W., 150 °C, 1h30. iv) ROH, NaH, NMP, M.W., 180 °C, 1 h; v) ROH, NaH, THF, r.t., 1–5 h; vi) HCO2H, Et3N, Pd(OAc)2 (0.1 equiv.), Xantphos (0.2 equiv.), THF, M.W., 150 °C, 15 min.
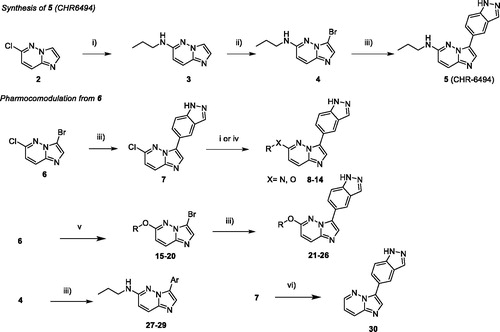
Table 1. Structure of synthesised derivatives and yields.
Table 2. IC50 (µM) of the imidazopyridazine derivatives on various protein kinases (in bold for haspin kinase). For selected compounds, the selectivity index for each kinase vs Haspin is shown in parentheses.
Figure 3. Binding mode of selected compounds with Haspin. (A) ATP competition assay with compound 12. (B) Crystal structure of Haspin with compound 12. The inhibitor is displayed in stick representation with yellow carbon atoms, and the key interactions with the kinase ATP binding site are shown. (C) Superimposition of the binding mode of compounds 12 (yellow carbon atoms) and 21 (grey carbon atoms) in Haspin active site. The three-letter amino acid code and residue number are labelled next to each side chain.
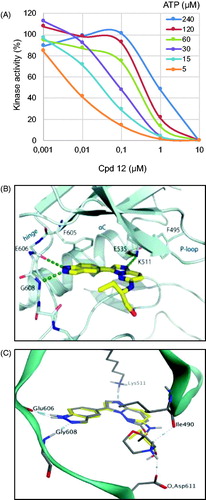
Table 3. Effects on cell viability.
Figure 4. Effects of compounds on spheroid viability. (A) Cell viability in spheroids from HCT116, HBL100 and U-2 OS cells was measured after 2 and 10 days of treatment with DMSO, staurosporine (1 µM) or compounds 5, 14, 29 at 5 µM, at a single dose on day 0. Cell viability was expressed in percentage of the DMSO control set at 100%. Data were acquired in triplicates, results are mean ± SEM, ***p ≤ 0.001, *p ≤ 0.05 (two-tailed unpaired t-test). (B) U-2 OS spheroids were treated with 5, 2.5 or 1 µM of compounds 5, 12, 14, 21 or 22, or with 1 µM of staurosporine or DMSO, at a single dose on day 0. Cell viability was measured after 2 and 10 days and expressed in percentage of the DMSO control set at 100%. Data were acquired in triplicates; graphs represent the mean of 2 independent experiments. Results are mean ± SEM, ****p ≤ 0.0001 (two-tailed unpaired t-test).
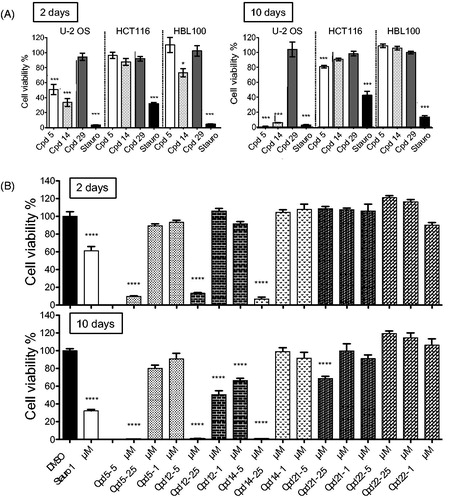
Figure 5. In-cell evaluation of Haspin inhibition. (A) immunofluorescence staining of U-2 OS cells treated for 24 h with 500 nM of each compound or 0.1% of DMSO. Haspin activity was monitored by staining of phosphorylated Histone H3 on threonine 3 (H3T3ph, green), deoxyribonucleic acid DNA was visualised by DAPI (4′,6-diamidino-2-phenylindole) staining (blue). Bar 10 µm. (B) Quantification of Haspin activity in prometaphase cells from (A); box and whiskers representation, n ≥ 30. (C) Statistical analysis of data obtained in (B). Results are mean ± SEM, p values are indicated (two-tailed unpaired t-test). Results are also shown in percentage of the DMSO control.
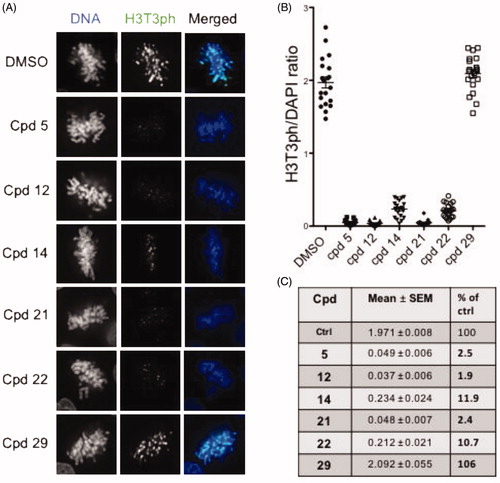
Figure 6. Cell cycle effects of selected compounds. (A) U-2 OS cells were treated with 2.5 µM of each compound for 24 h before ethanol fixation and propidium iodide staining. DNA content was measured by flow cytometry and representative profiles are shown. (B) quantification of the proportion of cells in each phase of the cell cycle from the experiment described in (A). Results are mean percentage (n = 3 independent experiments).
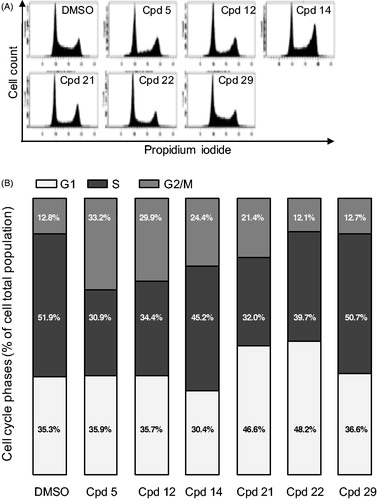
Table 4. IC50 (µM) of selected compounds on HsPLK1 and HsCDK1.
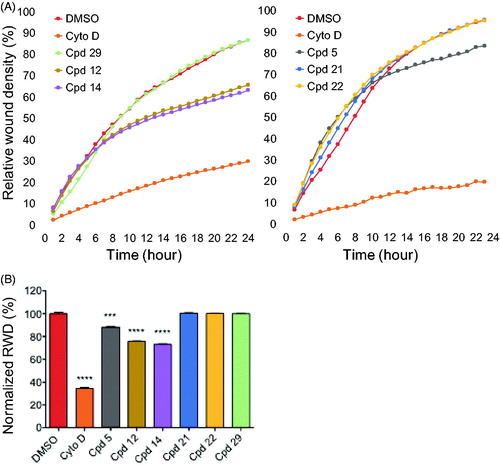
Figure 7. Effects of compounds on cell migration. (A) scratch wound cell migration assays were conducted on U-2 OS cells after treatment with 0.6 µM of each compound or 0.1 µg/mL cytochalasine D or 0.1% DMSO in two sets of experiments. Images were acquired every hour for 24 h 1by real-time live-cell microscopy (IncuCyte, Essen Bioscience) and images were analysed to determine the relative wound density (RWD) (IncuCyte software). Data are RWD mean ± SEM (n = 4). (B) Bar graph representation of the end point (24 h) of the experiment in A normalised against DMSO control (100%) for both sets of experiments. Results are mean percentage ± SEM; ***p ≤ 0.001, ****p ≤ 0.0001(two-tailed unpaired t-test).