Figures & data
Figure 1. Chemical structures of several examples of some reported N-4 piperazinyl ciprofloxacin derivatives with anti-proliferative activities.
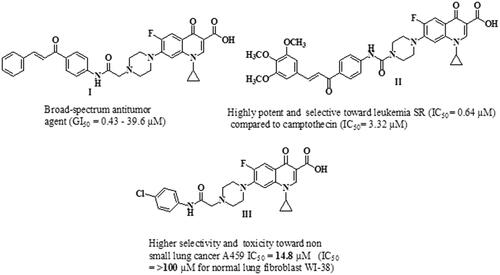
Figure 2. Potential anticancer drugs based on 1,2,3-triazole nucleus in active clinical trials.
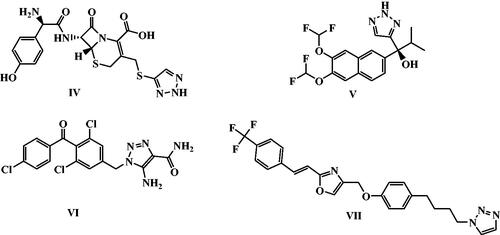
Figure 3. Some recently reported anti-proliferative 1,2,3-triazole/chalcone hybrids.
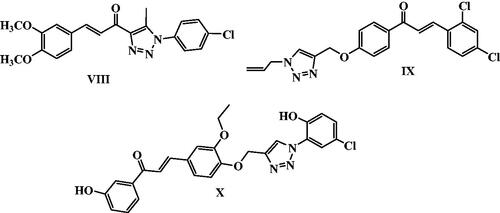
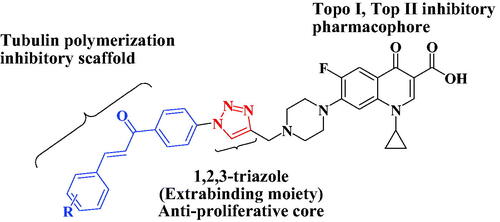
Figure 4. Pharmacophore of target compounds 4a-j.
Scheme 1. Reagents and conditions: (a) Conc. H2SO4, NaNO2, NaN3, 0–5 °C; (b) Proper aromatic aldehydes, 60% sodium hydroxide, ethanol, stirred overnight at 0–5 °C; (c) Propargyl bromide, NaHCO3, DMF, stirred overnight at 80 °C; (d) CuSO4·5H2O, Sodium ascorbate, DMF, CH2Cl2, MeOH, H2O (3:2:1:1) rt stirring 24 h.
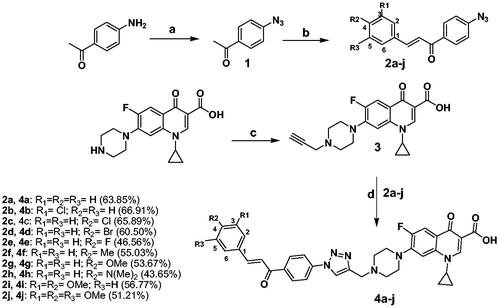
Table 1. GI50 in µM and total growth inhibition (TGI) in µM of compound 4j against 59 cell lines of nine cancer panels evaluated using NCI's in-vitro 5-dose antitumor assay.
Table 2: Cytotoxic effects of CP hybrids, 4a-j and doxorubicin against 3 colon cancer cell lines (Caco-2, HT-29, and HCT116).
Figure 5. Cytotoxic effects of CP hybrids (4a, 4b, 4e, 4i, and 4j) and doxorubicin against non-cancerous cells (HEK293) after 72 h incubation period. (A) Concentration-cell viability curves of CP hybrids and doxorubicin treated HEK293 cells using different concentrations (0.01–100 µM, n = 3) and 72 h incubation period. (B) IC50 values were estimated by fitting the cytotoxicity data into a linear regression model using GraphPad Prism software. Data were statistically compared by one-way ANOVA followed by Tuckey’s multiple comparisons test (****p < 0.0001, ns = not significant). (C and D). Microscopic images of HEK293 cells treated with different concentrations of CP hybrids (4a, 4b, 4e, 4i, and 4j) and doxorubicin for 72 h (20× objective lens, total magnification = 200×). Scale bar = 400 µM.
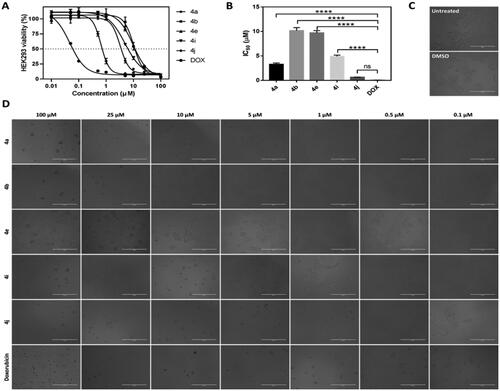
Figure 6. The effect of IC50 values of CP hybrids 4a, 4b, 4e, 4i, 4j and camptothecin (CPT, positive control in Topo-I assay) on the activity of human topoisomerase I. (A) DNA relaxation assay. (B) in-vitro enzyme assay. Data are plotted as means ± SEM of 3 experiments. ∗∗ p < 0.01 and ∗∗∗ p < 0.001 refer to the statistically significant differences in comparison to DMSO (vehicle, negative control treatment).
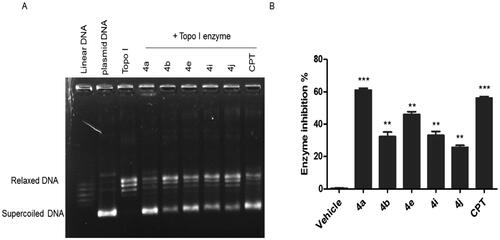
Figure 7. The effect of ciprofloxacin hybrids 4a, 4b, 4e, 4i, 4j, and etoposide (ETO, positive control in Topo-II assay) on the activity of human topoisomerase II. (A). Agarose gel electrophoresis of human topoisomerase II assay. (B). Topo-II inhibitory activity of ciprofloxacin hybrids.
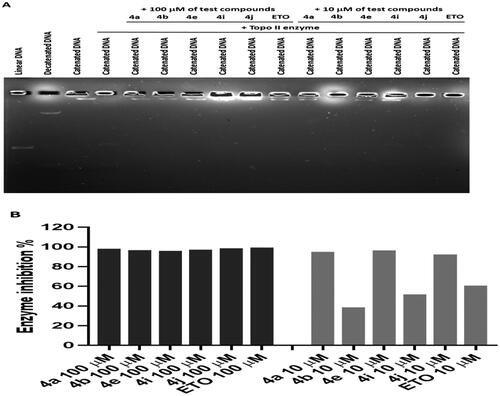
Figure 8. Effect of ciprofloxacin derivatives on tubulin polymerisation. HCT116 cells were untreated (control) and treated with IC50 values of compounds 4a, 4b, 4e, 4i, 4j, paclitaxel or nocodazole for 36 h. (A) Morphological changes of HCT116 cells visualised by immunofluorescence microscopy. Tubulin were shown in green and the nuclei were in blue. (B) Western blotting analysis.
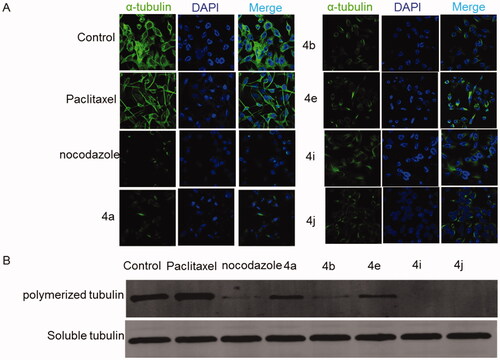
Figure 9. CP hybrids induce DNA damage. (A) γH2AX staining in HCT116 cells treated with IC50 values of CP hybrids 4a, 4b, 4e, 4i, 4j, or DMSO (negative control). (B) γH2AX-positive nuclei %. (C) Western blot revealed that levels of γH2AX were increased in HCT116 cells treated with CP hybrids 4a, 4b, 4e, 4i, 4j, DMSO (negative control), and GAPDH (loading control). (D) The relative protein level of γ-H2AX, in comparison to GAPDH was measured by ImageJ. Data are plotted as means ± SEM of 3 experiments. ∗ p < 0.05, ∗∗ p < 0.01, and ∗∗∗ p < 0.001 refer to the statistically significant differences in comparison to DMSO.
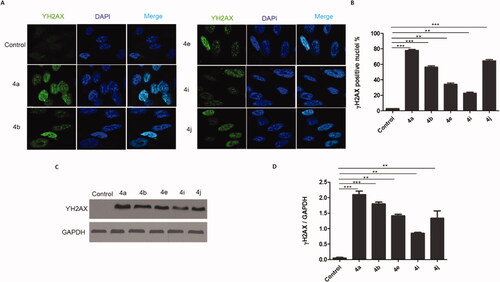
Figure 10. Analysis of cell cycle. HCT116 cells were treated with different concentrations of ciprofloxacin hybrids 4a, 4b, 4e, 4i, and 4j for 24 h. Doxorubicin, camptothecin, and etoposide were used as assay controls. The X-axis displays the fluorescence intensity corresponding to the DNA content per HCT116 cell. DNA histograms were analysed by ModFit LT software.
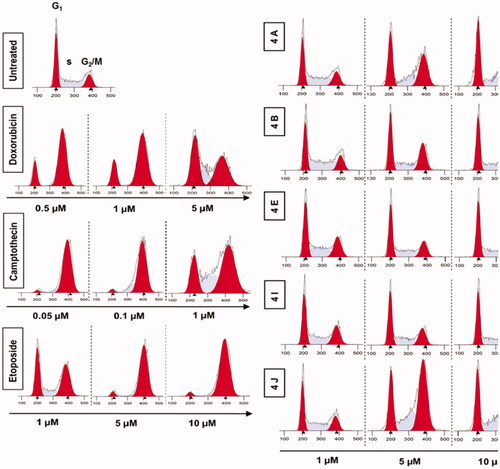
Figure 11. Ciprofloxacin hybrids 4a, 4b, 4e, 4i, and 4j induce G2/M cell cycle arrest possibly via ATR/CHK1/Cdc25C pathway A. Western blot revealed that expressions of p-ATR, p-CHK1, and p-Cdc25C were increased in HCT116 cells treated with Ciprofloxacin hybrids 4a, 4b, 4e, 4i, 4j, DMSO (negative control), and GAPDH (loading control) B. The relative protein levels of p-ATR, p-CHK1, and p-Cdc25C, compared to their total form ATR, CHK1, and Cdc25C, respectively, were measured by ImageJ. Data are plotted as means ± SEM of 3 experiments. * p < 0.05, ** p < 0.01, and *** p < 0.001 refer to the statistically significant differences in comparison to DMSO.
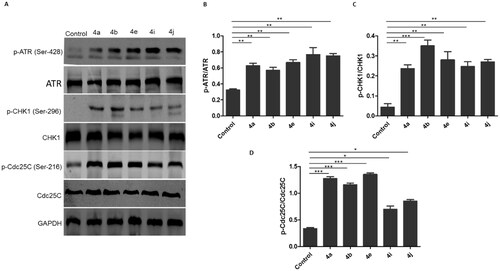
Table 3. ΔG values of the tested compounds 4a, 4b, 4e, 4i, 4j, and camptothecin in the active binding site of Topo I enzyme (PDB ID: 1T8I).
Table.4. ΔG values of the tested compounds 4a, 4b, 4e, 4i, 4j, and Etoposide in the active binding site of Topo II enzyme (PDB ID: 6ZY7).
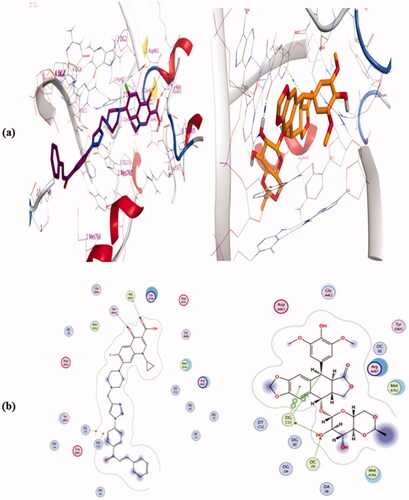
Figure 12. Binding mode and H-bonds interactions of compound 4a (left) and camptothecin (right) within 1T8I active site: (a) 3 D structure and (b) 2D interactions.
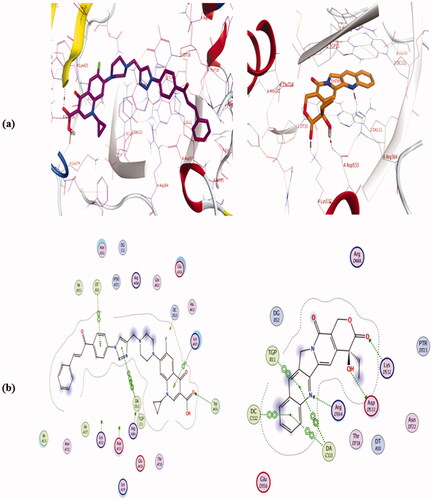
Figure 13. Binding mode and H-bonds interactions of compound 4a (left) and etoposide (right) within 6ZY7 active site: (a) 3 D structure and (b) 2 D interactions.