Figures & data
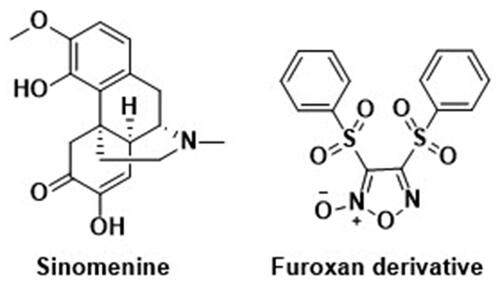
Figure 1. The chemical structures of reported Sinomenine and furoxan derivatives.
Scheme 1. Synthesis of 1–4, 5A–E, 6A–E(a–c) and 7A–E(a–c). Reagents and conditions: (a) ClCH2COOH, NaOH (aq), reflux, 2 h; (b) 30% H2O2, AcOH, rt, 3 h; (c) fuming HNO3, 100 °C, 8 h; (d) corresponding diol, THF, 30% NaOH, 0 °C, 1 h; (e) corresponding anhydrides, TEA, DMAP, DCM, rt, 2 h; (f) DMAP, EDCI, rt, 4 h.
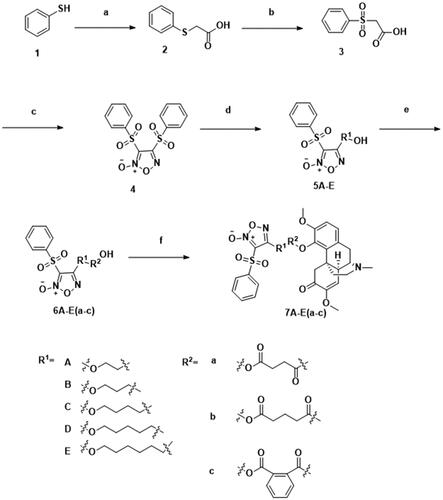
Table 1. The antiproliferative effects of the target compounds and parent compounds against different cell lines.
Figure 2. NO-releasing ability of several selected target compounds. The values were expressed as averages of three independent experiments.
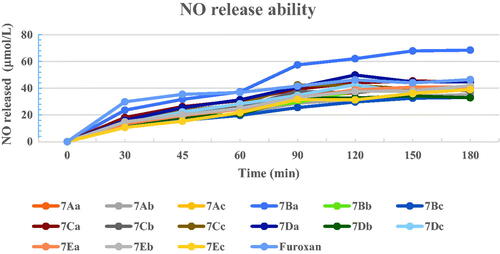
Figure 3. MDA-MB-231 cells were treated with 7Cc and Cells were stained with PI and investigated by flow cytometry. Data are represented as mean ± SD of three independent experiments. *p < 0.05, **p < 0.01, ***p < 0.001 vs control group. Statistical analyses were carried out on GraphPad.Prism software under ordinary one-way ANOVA method and compared with the control group.
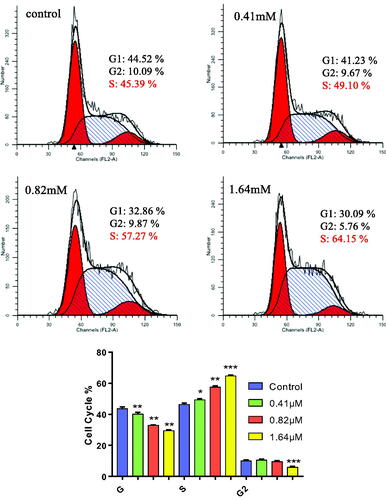
Figure 4. Flow cytometry analysis of apoptosis induced by 7Cc in MDA-MB-231 cells. Data are represented as mean ± SD of three independent experiments. **p < 0.01, ***p < 0.001 vs control group. Statistical analyses were carried out on GraphPad.Prism software under ordinary one-way ANOVA method and compared with the control group.
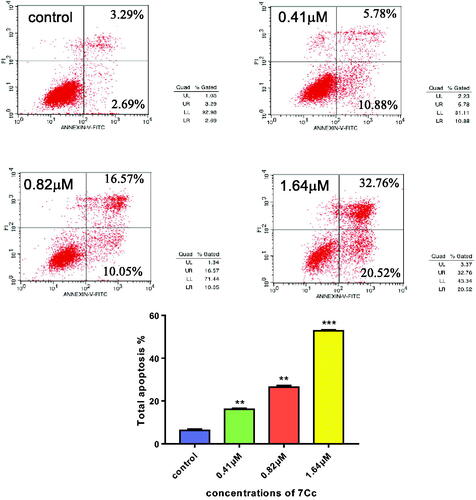
Figure 5. 7Cc induced mitochondrial depolarisation in MDA-MB-231 cells. Data are represented as mean ± SD of three independent experiments. **p < 0.01, ***p < 0.001 vs control group. Statistical analyses were carried out on GraphPad.Prism software under ordinary one-way ANOVA method and compared with the control group.
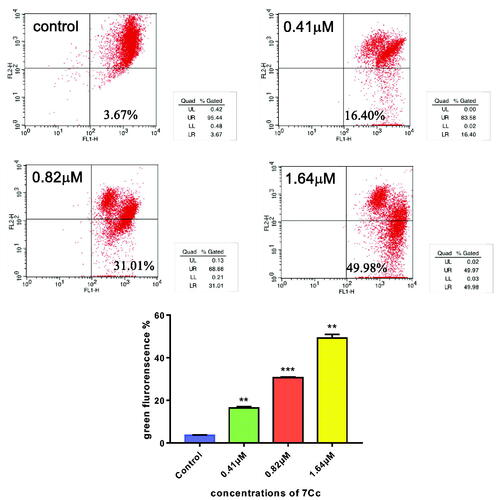
Figure 6. (a) MDA-MB-231 cells were treated with 7Cc, sterile pipette tips were used to scratch evenly, the incubation was continued, and representative images were captured. (b) MDA-MB-231 cells were seeded onto chambers and incubated with 7Cc, stained with crystal violet, and representative images were photographed. (c) MDA-MB-231 cells were incubated with 7Cc, then fixed, washed and photographed with a fluorescence microscope. All data are represented as the mean ± SD of three independent experiments. *p < 0.05, **p < 0.01, ***p < 0.001 vs the control group. Statistical analyses were carried out on GraphPad.Prism software under ordinary one-way ANOVA method and compared with a control group.
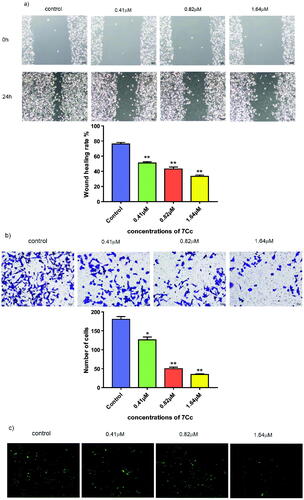
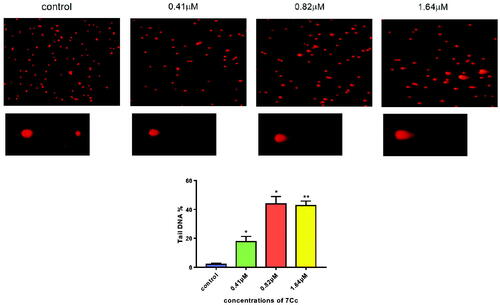
Figure 7. MDA-MB-231 cells were incubated with 7Cc. Comet assay was used to evaluate DNA damage and photomicrographs were provided. Data are represented as mean ± SD of three independent experiments. *p < 0.05, **p < 0.01 vs control group. Statistical analyses were carried out on GraphPad.Prism software under ordinary one-way ANOVA method and compared with a control group.