
Figures & data
Figure 1. (A) Some reported VEGFR inhibitors showing the essential pharmacophoric features that occupy the different regions of the ATP binding site. (B) reported TNFα inhibitor with its pharmacophoric features.
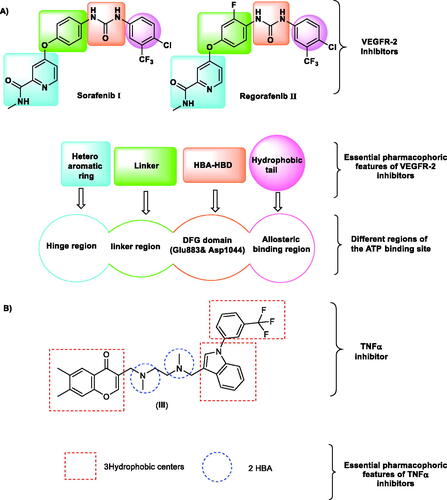
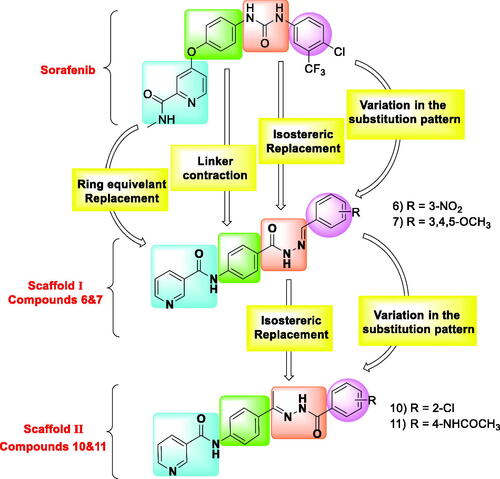
Figure 2. Strategies of molecular design.
Scheme 1. Synthetic route of target compounds 6, 7, 10, and 11.
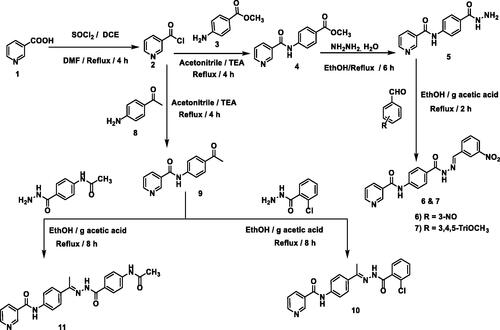
Table 1. In vitro cytotoxic activities of the target compounds against HCT-116 and HepG-2 cell lines and in vitro inhibitory activities against VEGFR-2.
Figure 3. Cell cycle phases after the treatment of HCT-116 Cells with compound 7.
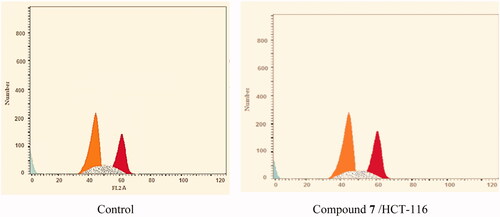
Figure 4. Flow cytometric analysis of cell cycle phases after treatment with compound 7.
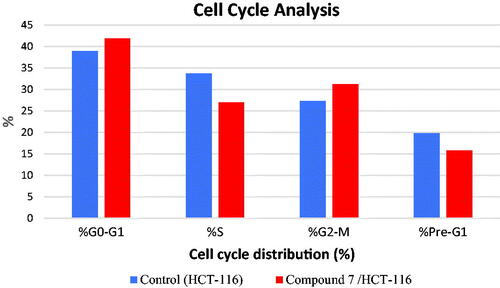
Table 2. Effect of compound 7 on cell cycle phases of HCT-116 cells
Figure 5. Apoptosis effect of compound 7 in HCT-116 cells.
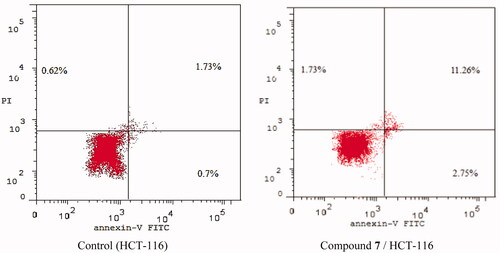
Figure 6. Flow cytometric analysis of apoptosis in HCT-116 cells exposed to compound 7.
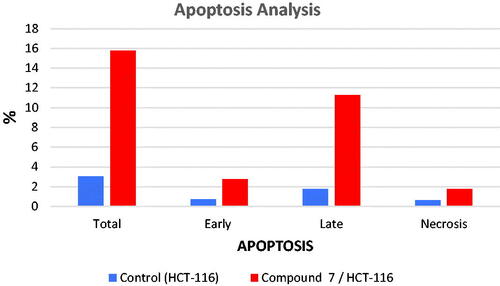
Table 3. Stages of the cell death process in HCT-116 cells after treatment with compound 7
Table 4. Effect of compounds 7 and 10 on the levels of TNF-α and IL-6 in HCT-116 cells.
Table 5. The calculated ΔG (binding free energies) of the synthesised compounds and reference drug sorafenib against VEGFR-2 (ΔG in Kcal/mole).
Figure 7. (A) 3D binding mode of compound 6 into VEGFR-2 active site, (B) 2D binding mode of compound 6 into VEGFR-2 active site.
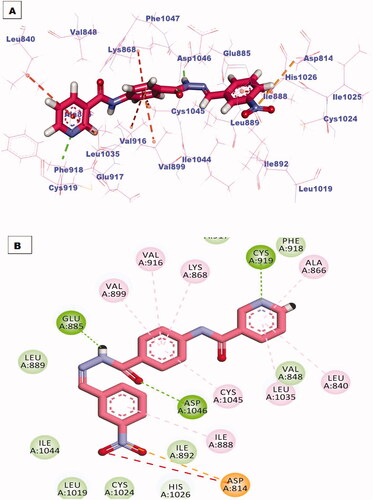
Figure 8. (A) 3D binding mode of compound 7 into VEGFR-2 active site, (B) 2D binding mode of compound 7 into VEGFR-2 active site.
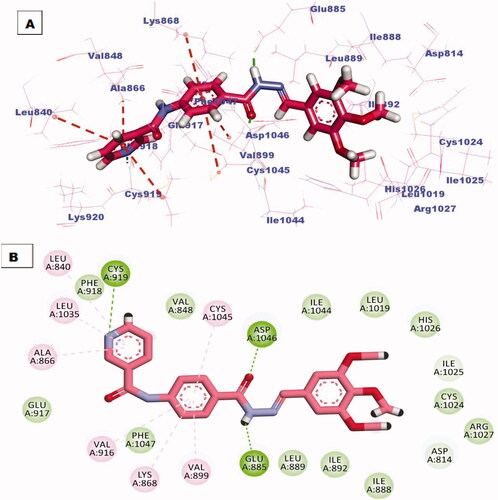
Figure 9. (A) 3D binding mode of compound 7 against TNF-α protein, (B) 2D binding mode of compound 7 against TNF-α protein.
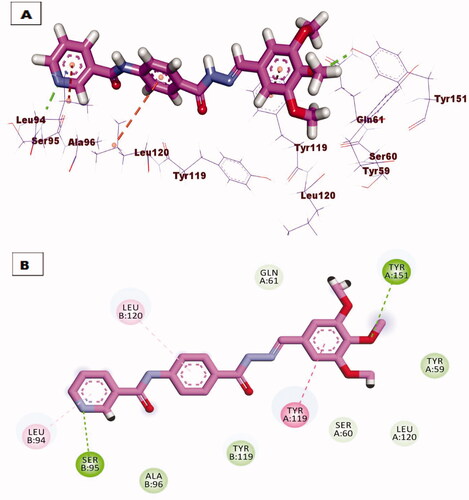
Figure 10. (A) 3D binding mode of compound 10 against TNF-α protein, (B) 2D binding mode of compound 10 against TNF-α protein.
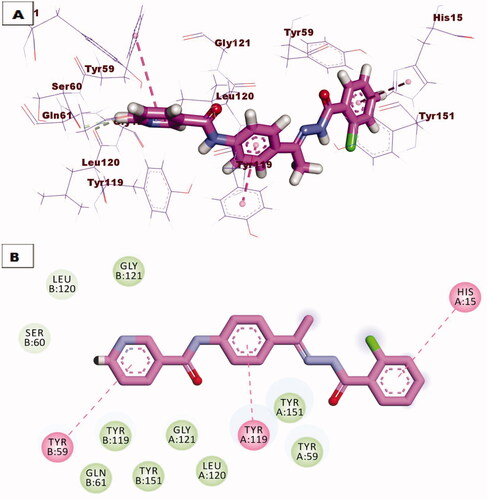
Figure 11. (A) 3D binding mode of compound 7 against IL-6 protein, (B) 2D binding mode of compound 7 against IL-6 protein.
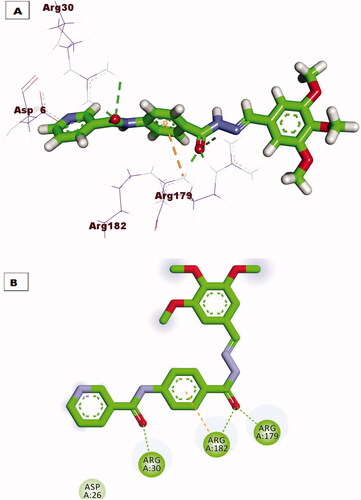
Figure 12. (A) 3D binding mode of compound 10 against IL-6 protein, (B) 2D binding mode of compound 10 against IL-6 protein.
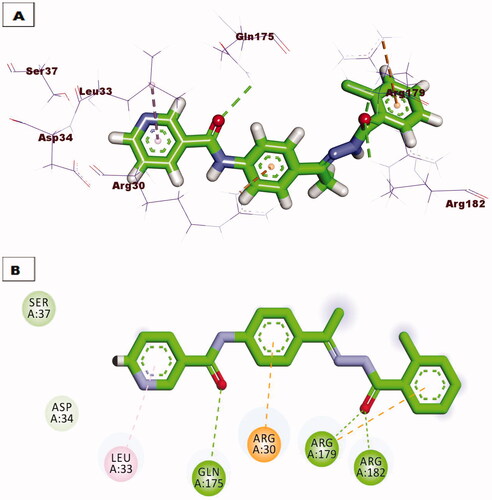
Figure 13. MD simulations experiment; (A) RMSD values of VEGFR-2 -compound 7 before and after binding, (B) RMSF of VEGFR-2 -compound 7 complex, (C) Rg of VEGFR-2 -compound 7 complex (D) SASA of VEGFR-2 -compound 7 complex, (E) H- bonding between VEGFR-2 -compound 7 complex.
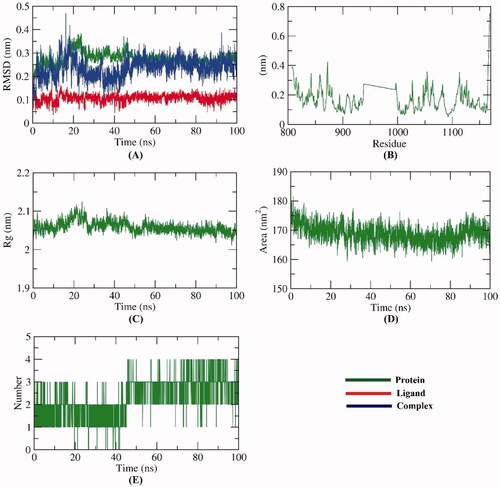
Figure 14. MM-PBSA results of VEGFR-2 -compound 7 complex.
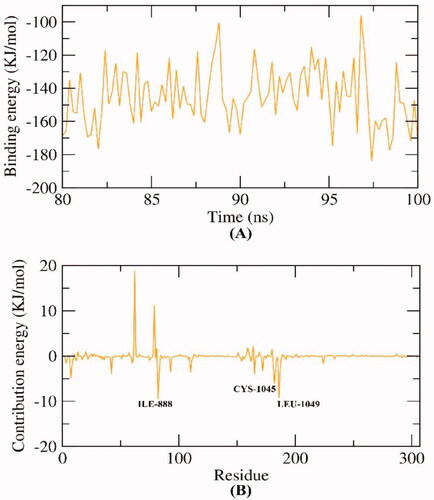
Figure 15. MD simulations experiment; (A) RMSD values of IL-6-compound 7 complex before and after binding, (B) Rg of IL-6-compound 7 complex, (C & D) RMSF of IL-6-compound 7 complex, (E) SASA of IL-6-compound 7 complex, (F) H- bonding between IL-6-compound 7 complex.
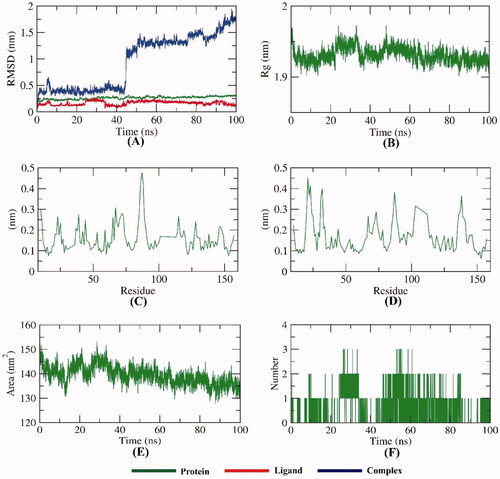
Figure 16. MD simulations experiment; (A) RMSD values of TNF-α-compound 7 complex before and after binding, (B) Rg of TNF-α-compound 7 complex, (C & D) RMSF of TNF-α-compound 7 complex, (E) SASA of TNF-α-compound 7 complex, (F) H- bonding between TNF-α-compound 7 complex.
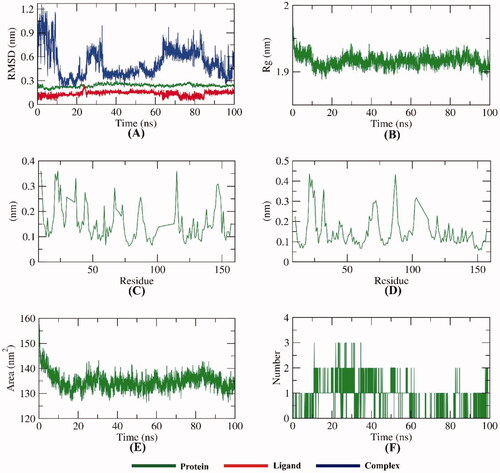
Figure 17. The predicted ADMET parameters.
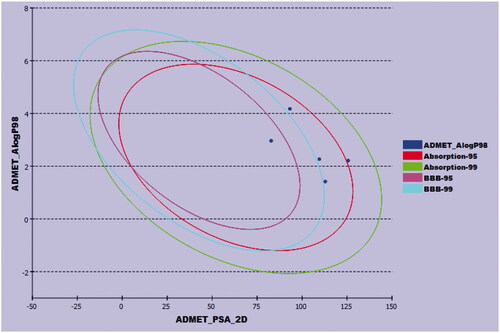
Table 6. In silico toxicity potential of the synthesised compounds