
Figures & data
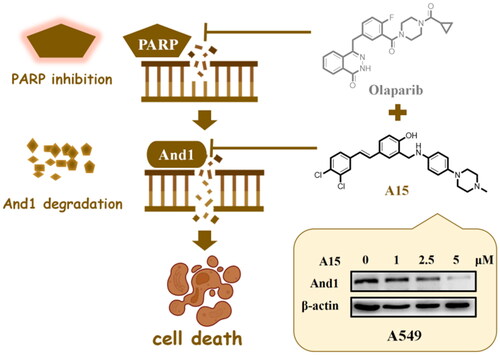
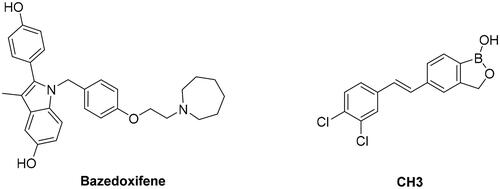
Figure 1. Structures of the two And1 degraders.
Scheme 1. Synthesis of compounds A1-A27a. aReagents and conditions: (a) paraformaldehyde, HCl, 25 °C, 24 h; (b) PPh3, ACN, 80 °C, 3 h; (c) EtONa, EtOH, 75 °C, 3 h; (d) amine, K2CO3, DMF, 100 °C, 1.5–3 h; (e) SnCl2, HCl, EtOH, 60 °C, 2–4 h; (f) RNH2, EtOH, 70 °C, 1 h; (g) NaBH4, MeOH/THF, rt, 30 min.
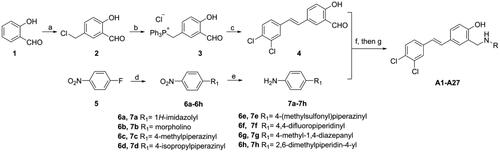
Figure 2. Structure formula and activity evaluation of compounds. (A) Compounds containing different substituents. (B) Quantification of And1 by gray-scale analysis. The expression of And1 was determined after 48 h treatment with DMSO or compounds A1–A27 (10 µM) by Western Blot (supplemental Figure S1). The Control group was normalised. The tests were conducted three times, and data were shown as mean ± the standard error of the mean (SEM); p values were calculated by two-sided Student’s t-test. *(p ≤ 0.05), **(p ≤ 0.01), ***(p ≤ 0.005), ****(p ≤ 0.001).
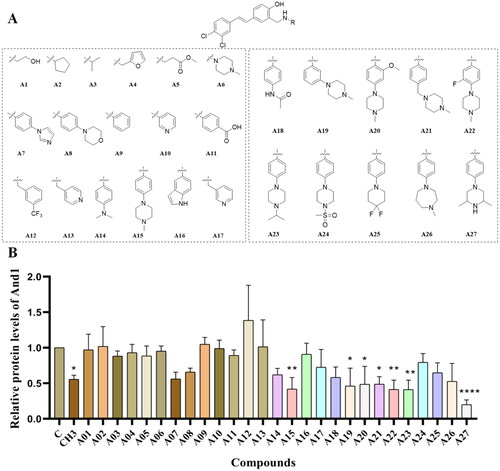
Figure 3. Degradation kinetics of compound A15. (A, B) A15 degrades the And1 in a dose-dependent manner in H460 (A) and A549 (B) cells at 48 h. (C) Degradation of And1 by A15 can be intercepted by the proteasome inhibitor MG132. (D) Degradation of And1 by A15 (10 µM) at 0–48 h.
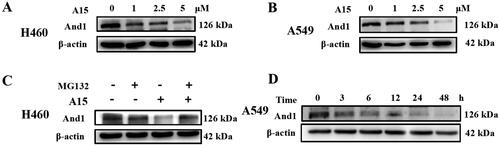
Figure 4. Molecular simulation and binding pattern analysis of A15. (A) Potential energy surface scan of compound A15 based on the MM2 force field. (B) The conformation of A15 corresponding to the dihedral angles formed by C(10)-C(11)-C(18)-C(32) at −70°, −25°, 45°, and 90°. (C) Potential energy surface scan of compound A15X. (D) The conformation of A15X at the lowest potential energy. (E) Western Blot of And1 after 10 µM treatment with A15/A15X in A549. (F) Quantification of And1 in (E) by gray-scale analysis. (G) Predicted binding modes of A15 with And1 (PDB code: 5GVA).
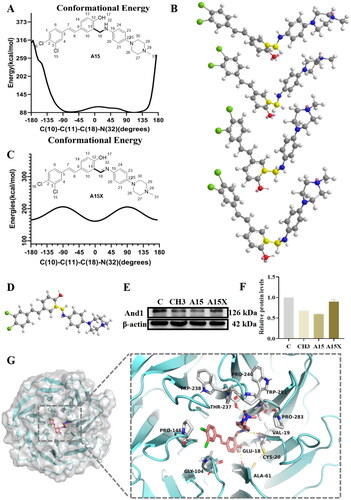
Figure 5. Effects of Olaparib, A15, and the combination of both on lung cancer cell proliferation. (A, B) CCK-8 detects the proliferation of Olaparib (1 µM), A15 (5 µM) or both of them in combination on A549 or H460 cells. (C, D) Proliferation curves for Olaparib (1 µM), A15 (5 µM), Olaparib (1 µM)+A15 (5 µM) and Olaparib (1 µM)+CH3 (5 µM) on A549 (C) or H460 (D) cells. The tests were conducted three times, and data were shown as mean ± the standard error of the mean (SEM).
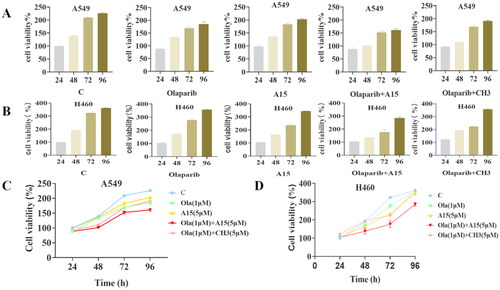
Figure 6. The effect of compound A15 (5 µM) combined with Olaparib (1 µM) on clone formation of A549 (A) and H460 (B), and the quantitative analysis is represented by the bar chart. The significance analysis was performed using the one-way ANOVA. (***p < 0.001, ****p < 0.0001 compared with different groups). The error bars represent mean ± s.d.
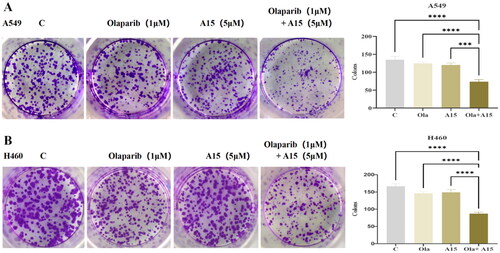
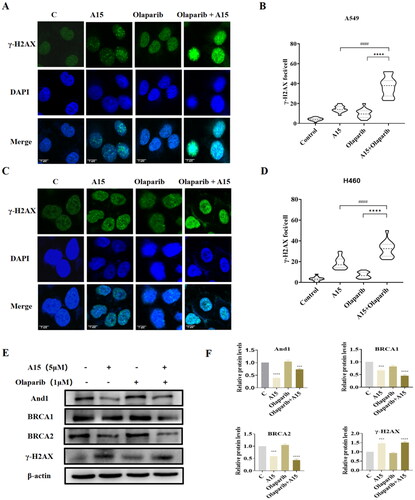
Figure 7. Effects of Olaparib, A15, and the combination of both on DNA damage and HR repair in NSCLC cells. (A, B) Immunofluorescence assay to detect the effect of the combination of A15 (5 µM) and Olaparib (1 µM) on focal γ-H2AX content in A549 cells (A, scale bar: 5 μm) and quantification plots (B, mean ± SD, n = 3, > 100 cells counted in each independent experiment, ****p < 0.0001, ####p < 0.0001). (C, D) Immunofluorescence assay to detect the effect of the combination of A15 and Olaparib on focal γ-H2AX content in H460 cells (C, scale bar: 5 μm) and quantification plots (D, mean ± SD, n = 3, > 100 cells counted in each independent experiment, ****p < 0.0001, ####p < 0.0001). (E, F) The expression of And1, BRCA1, BRCA2, and γ-H2AX in A549 cell were determined after 48 h treatment with Olaparib (1 µM), A15 (5 µM), and the combination of both by Western Blot (E) and quantification plots (F, mean ± SD, n = 3, ***p < 0.001, ****p < 0.0001).
Olaparib+A15-Merge.tif
Download TIFF Image (1.9 MB)A15-γH2AX- 7c.tif
Download TIFF Image (883.3 KB)Control-DAPI.tif
Download TIFF Image (1.2 MB)Olaparib-γ-H2AX.tif
Download TIFF Image (860.7 KB)Olaparib+A15-DAPI.tif
Download TIFF Image (975.3 KB)FigureS1B-And1.tif
Download TIFF Image (14.1 MB)FigureS1D-ª┬-actin.png
Download PNG Image (426.6 KB)
Figure3D-β-actin.tif
Download TIFF Image (14.1 MB)Olaparib+A15-Merge- 7c.tif
Download TIFF Image (2.1 MB)Control-Merge- 7c.tif
Download TIFF Image (1.4 MB)Olaparib-DAPI.tif
Download TIFF Image (978.5 KB)Figure3A-ª┬-actin.png
Download PNG Image (587.1 KB)
Figure3C-And1.tif
Download TIFF Image (14.1 MB)Olaparib+A15-γ-H2AX- 7c.tif
Download TIFF Image (1.2 MB)Control-DAPI- 7c.tif
Download TIFF Image (770.1 KB)A15-Merge- 7c.tif
Download TIFF Image (1.6 MB)FigureS1E-And1.tif
Download TIFF Image (14.1 MB)Figure4E-And1.tif
Download TIFF Image (14.1 MB)Figure7E-ª┬-actin.png
Download PNG Image (431.3 KB)
Figure4E-ª┬-actin.png
Download PNG Image (79.5 KB)
Control-γH2AX.tif
Download TIFF Image (1 MB)A15-DAPI- 7c.tif
Download TIFF Image (918.2 KB)FigureS1C-And1.tif
Download TIFF Image (14.1 MB)Olaparib-DAPI- 7c.tif
Download TIFF Image (857.4 KB)FigureS1D-And1.tif
Download TIFF Image (14.1 MB)A15-Merge.tif
Download TIFF Image (1.8 MB)Figure7E-BRCA2.tif
Download TIFF Image (14.1 MB)Figure7E-BRCA1.tif
Download TIFF Image (14.1 MB)Figure7E-And1.tif
Download TIFF Image (14.1 MB)FigureS1A-And1.tif
Download TIFF Image (14.1 MB)supplementary_data.docx
Download MS Word (9.5 MB)Figure3B-And1.tif
Download TIFF Image (14.1 MB)Figure3B-ª┬-actin.png
Download PNG Image (587.8 KB)
Olaparib-γ-H2AX- 7c.tif
Download TIFF Image (755.5 KB)Olaparib+A15-DAPI- 7c.tif
Download TIFF Image (1.1 MB)Control-Merge.tif
Download TIFF Image (2.1 MB)Figure7E-ª├-H2AX.tif
Download TIFF Image (14.1 MB)Figure3C-ª┬-actin.png
Download PNG Image (403.8 KB)
Figure3A-And1.tif
Download TIFF Image (14.1 MB)Olaparib+A15-γ-H2AX.tif
Download TIFF Image (1 MB)Figure3D-And-1.tif
Download TIFF Image (14.1 MB)Olaparib-Merge.tif
Download TIFF Image (1.7 MB)A15-γ-H2AX.tif
Download TIFF Image (912.4 KB)A15-DAPI.tif
Download TIFF Image (1.1 MB)FigureS1C-ª┬-actin.png
Download PNG Image (492.9 KB)
Olaparib-Merge- 7c.tif
Download TIFF Image (1.5 MB)FigureS1B-ª┬-actin.png
Download PNG Image (94.1 KB)
Control-γ-H2AX- 7c.tif
Download TIFF Image (690.8 KB)FigureS1A-ª┬-actin.png
Download PNG Image (564.1 KB)
FigureS1E-ª┬-actin.png
Download PNG Image (476.2 KB)
Data availability statement
The datasets presented in the current study are available from the corresponding author upon reasonable request.