Figures & data
Figure 1. Theory of action.

Figure 2. Example of an item on a student phone screen.

Figure 3a and 3b. Examples of the feedback in the teacher web environment.
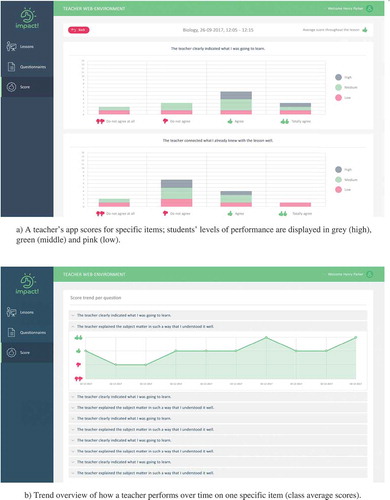
Table 1. Teaching aspects (items) related to the teaching dimensions and practices.
Figure 4. Measurement moments in the experimental group and the control group.
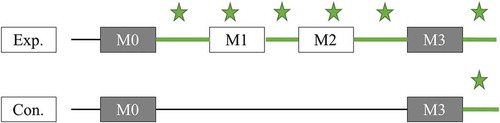
Table 2. Background characteristics of the 60 teachers (on M0).
Figure 5. The perceived areas by teachers for improvement (percentage of teachers) on the three measurement moments.
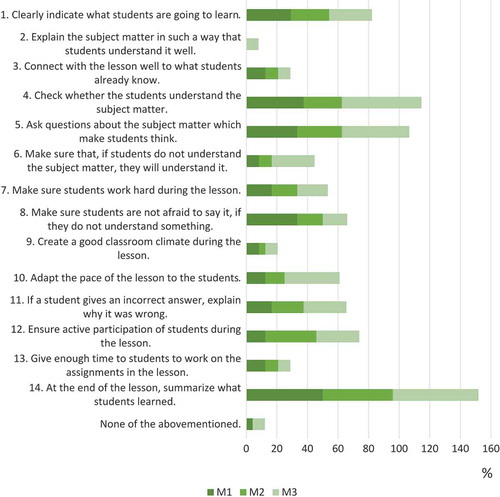
Figure 6. The improvement-oriented actions undertaken by teachers during the lessons at M1, M2 and M3 (percentages of teachers).
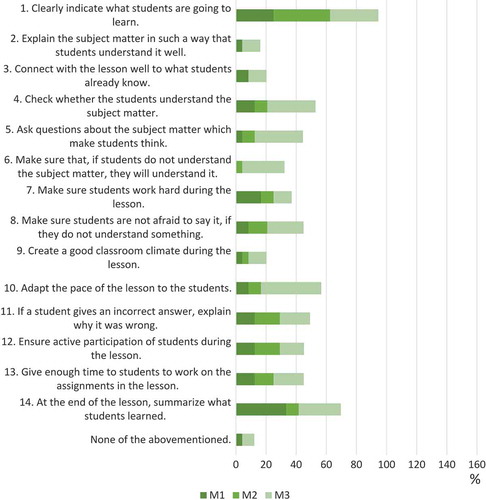
Figure 7. Percentage of teachers who reported they undertook the improvement-oriented actions outside the lesson on the three measurement moments (M1, M2 and M3).
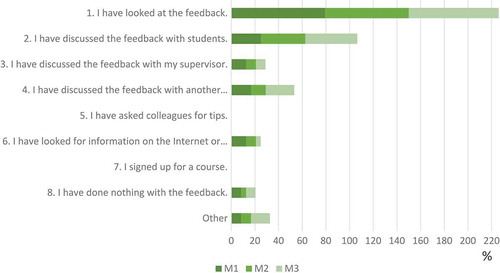
Figure 8. Average teaching quality (a time period includes five days). Due to a holiday period in the Netherlands, no measurement was conducted in time periods 7, 8 and 9. Time period 18 was a holiday period as well, but because not all schools are off in the same week, two measurements were conducted in that period explaining the small decline in this period.
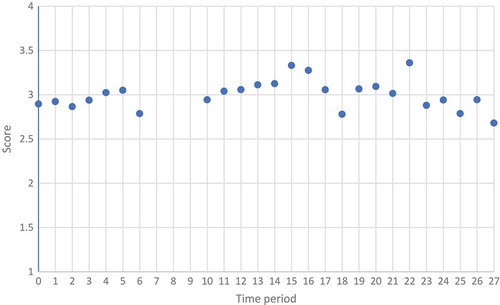
Table 3. Multilevel models.
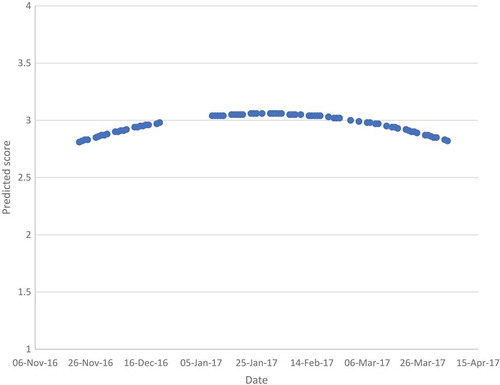
Figure 9. Predicted values of teachers’ teaching quality plotted against date.