
Figures & data
Table 1. The relative pre- and post-testing (mean ± standard deviation) and difference (mean difference ± 95% confidence limits [CL]) results for double-leg drop landing (DLDL), single-leg drop landing (SLDL), countermovement jump (CMJ) and isometric mid-thigh pull (IMTP), in cricket pace bowlers (n = 10).
Figure 1. Displays the Hotellings T2 trajectory SPM (T2). The T2 statistic as a function of time, describing the strength and slope of the relationship between pre- and post-testing measures. The dotted horizontal line indicates the critical random field theory thresholds for significance of T2 = 40.507 with a family wise error rate of α = 0.05. No portion of the trajectory exceeded the threshold therefore no follow-up tests were performed for scalar field analysis.
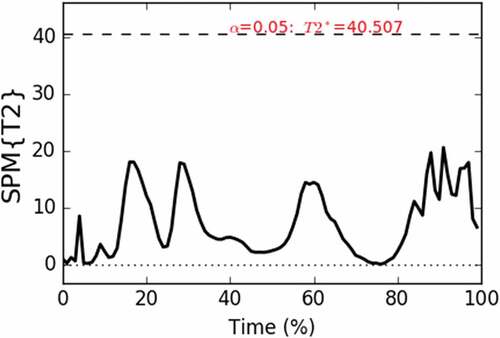
Figure 2. (a) The braking/propulsive GRF (GRFy;) and (b) vertical GRF (GRFz) pre- and post-training represented as the cross-participant mean trajectory with a standard deviation cloud. The pre-training is depicted with a black line and dark grey cloud while post-training is depicted using a dashed grey line with light grey cloud.
Table 2. Relative peak vertical force, braking force and vertical and braking impulse between pre- and post-testing (mean ± standard deviation) and difference (mean difference ± 95% confidence limits [CL]) during front foot contact in cricket pace bowlers (n = 10).