Figures & data
Figure 1. Example marker set-up.
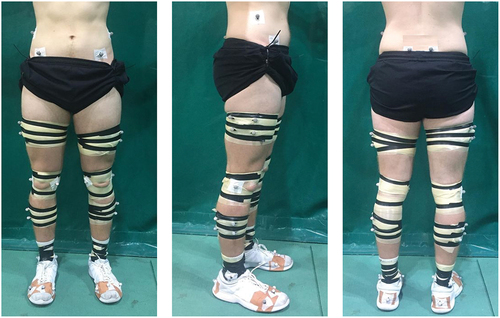
Figure 2. Laboratory set-up with artificial turf.
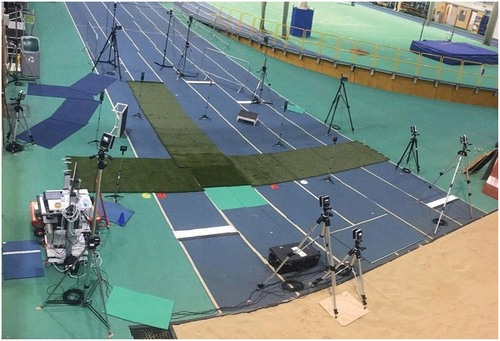
Figure 3. Differences in vertical and anterior-posterior GRF between surfaces for the bilateral drop jump (a and d, respectively), the unilateral drop jump (b and e, respectively), and the cut (c and f, respectively). The top panel of each graph represents the mean and SD clouds for the different surfaces with the black representing Mondo track and red representing artificial turf. The middle panel shows the SPM{t}– the t-statistic as a function of time describing the differences between the two surfaces, with the dashed red lines representing the critical threshold, and the shaded portion of the curve indicating p < 0.05. The bottom panel shows the ES as a function of time describing the magnitude of the effect, with the dashed grey and thick dashed grey lines representing the thresholds for Cohen’s d > 0.5 and d > 0.8, respectively. Bold p-values indicate p ≤ 0.05 and Cohen’s d > 0.5 over a duration >5%. GRF = ground reaction force; SD = standard deviation; SPM = statistical parametric mapping; ES = effect size; V = vertical; AP = anterior–posterior.
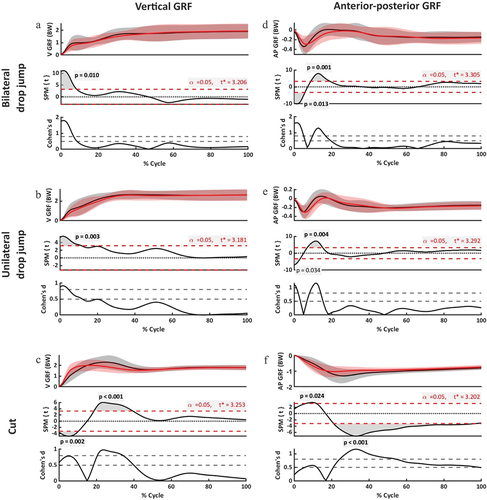
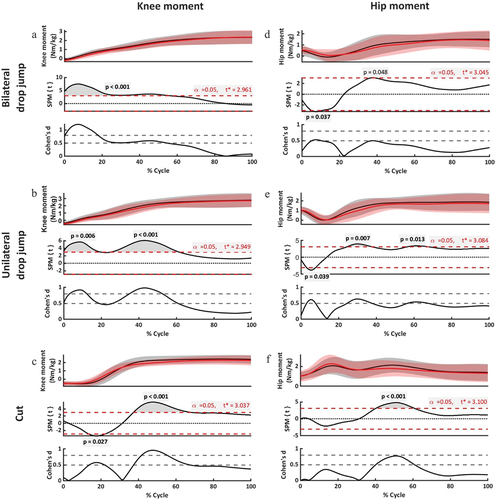
Figure 4. Differences in sagittal plane knee and hip moments between surfaces for the (a and d) bilateral drop jump, (b and e) unilateral drop jump, and (c and f) cut. The top panel of each graph represents the mean and SD clouds for the different surfaces with the black representing Mondo track and red representing artificial turf. The middle panel shows the SPM{t}– the t-statistic as a function of time describing the differences between the two surfaces, with the dashed red lines representing the critical threshold, and the shaded portion of the curve indicating p < 0.05. The bottom panel shows the ES as a function of time describing the magnitude of the effect, with the dashed grey and thick dashed grey lines representing the thresholds for Cohen’s d > 0.5 and d > 0.8, respectively. Bold p-values indicate p ≤ 0.05 and Cohen’s d > 0.5 over a duration >5%. Positive values represent external flexion moments. SD = standard deviation; SPM = statistical parametric mapping; ES = effect size.