
Figures & data
Table 1. Definitions of indicators and thresholds for indicator-based assessment.
Figure 1. Different risk zones in the assessment of composite indicators.
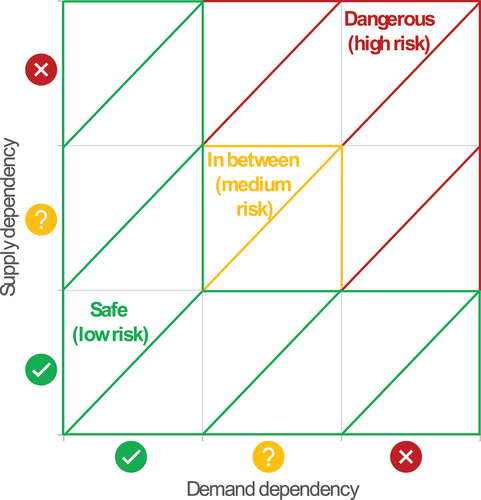
Figure 2. Illustration of gas dependency with composite indicators for new (left) and old (right) member states for 2004.
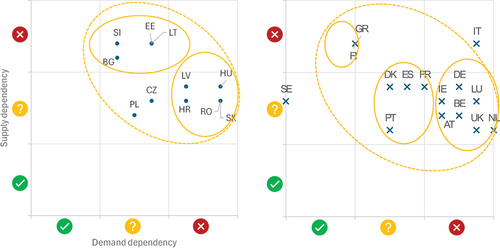
Figure 3. Illustration of changing Russian gas dependency in new member states from 2004 to 2019 and 2022, based on the composite indicators.
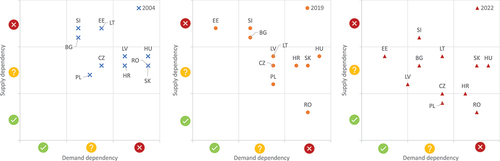
Figure 4. Illustration of changing Russian gas dependency in old member states from 2004 to 2019 and 2022, based on the composite indicators.
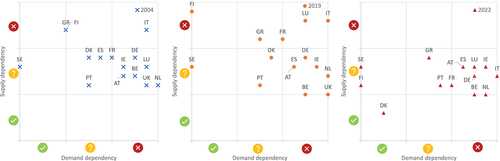
Figure 5. Illustration of changing Russian gas dependency in the EU member states with composite dependency indicator pathways from 2004 to 2019 and 2022, alongside targets set in energy strategies of the new member states, country by country.
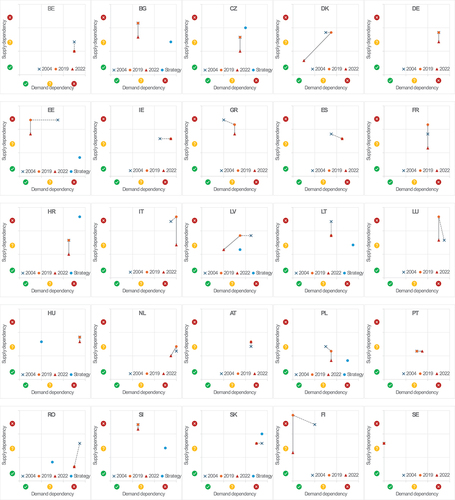
Table 2. Categorisation of data in energy strategies of new member states.