Figures & data
Figure 1. For the as-cast sample of Cu46Zr46Al7Gd1 bulk metallic glass, example nanoindentation loading protocols and resulting load-displacement curves for: (a) a simple indentation; and (b) cyclic elastic loading followed by indentation.
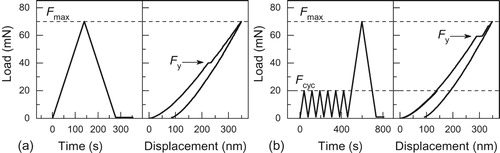
Figure 2. (Colour online) From multiple loading curves for nanoindentation of Cu46Zr46Al7Gd1 bulk metallic glass in its as-cast state, and after various combinations of elastic cycling (EC), cryogenic thermal cycling (CTC) and annealing, cumulative distributions of: (a) initial yield load Fy; (b) initial yield pressure Py; (c) initial pop-in size Δh; (d) average indenter velocity v during pop-ins; (e) hardness H; and (f) indentation modulus Er.
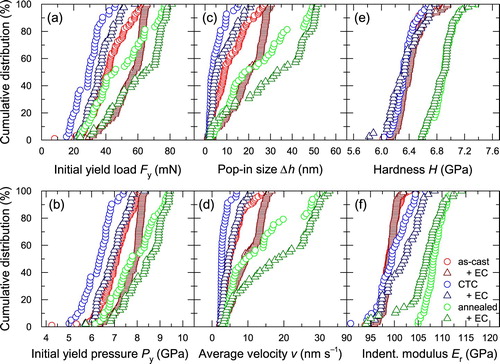
Table 1. Obtained from multiple loading curves in nanoindentation, the cumulative distributions for initial yield load Fy, initial yield pressure Py, initial pop-in size Δh, average velocity during pop-ins v, hardness H, and indentation modulus Er, are characterised by the median property value and the relative width of the distribution, defined to be ± half of the range from the 1st to 9th decile, divided by median value.
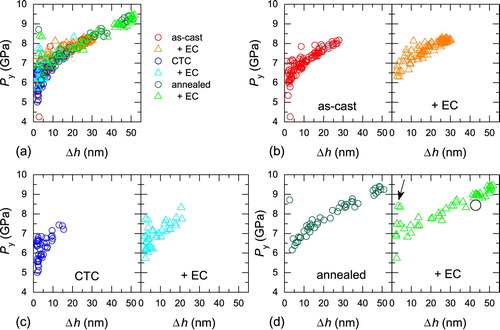
Figure 3. (Colour online) Relationship between the initial yield stress Py and the displacement increment Δh during the initial pop-in: (a) for all sample states; and for the effects of elastic cycling (EC) on (b) the as-cast MG; (c) the MG subjected to cryogenic thermal cycling (CTC); and (d) the annealed MG. In (d), the arrow highlights an example of an initial pop-in that is much smaller than would be expected for its Py value; the Py and Δh values of the subsequent pop-in on the same loading curve are indicated by the open circle.