
Figures & data
Figure 1. Ductile-to-brittle transition temperatures (squares, left ordinate) and mean widths of elongated grains (circles, right ordinate) of doped drawn wires (according to A.J. Opinsky, L. Sama and L. Seigle (1958), see [Citation12]).
![Figure 1. Ductile-to-brittle transition temperatures (squares, left ordinate) and mean widths of elongated grains (circles, right ordinate) of doped drawn wires (according to A.J. Opinsky, L. Sama and L. Seigle (1958), see [Citation12]).](/cms/asset/628c7e2d-55f1-40ce-be5e-d444bc02569e/tphm_a_2184877_f0001_oc.jpg)
Table 1. Composition of the sintered rod representing the starting point of the wire series investigated in this study.
Table 2. Diameters and accumulated drawing strains of the tungsten wires investigated.
Figure 3. Temporal stress evolution during a repeated stress relaxation experiment performed on a drawn tungsten wire with a diameter of at room temperature. The inset shows the temporal stress decay
during the five relaxation cycles performed. For better visibility, only every fifth measured data point is drawn. The dashed lines represent the fitted stress decays following Equation (Equation15
(15)
(15) ).
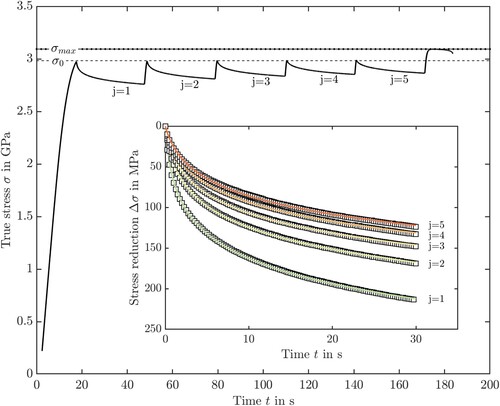
Figure 2. Temporal evolution of true strain (left y-axis) and stress (right y-axis) during a strain-rate jump test performed on a tungsten wire with a diameter of . Dashed vertical lines mark the times at which a strain-rate jump was performed. The two zoomed insets show jumps from low to high (green, left side) and from high to low strain rate (red, right side).
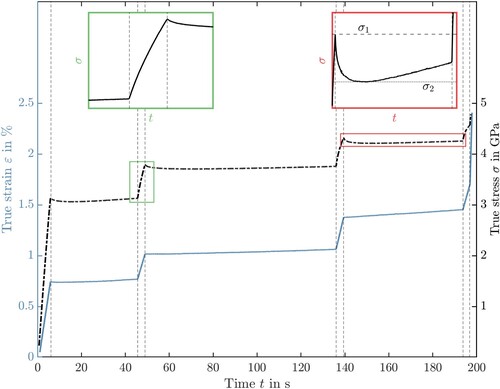
Figure 4. Mean maximum stresses (black symbols, from RSRE) and yield strengths
(blue symbols, from RSRE and SRJT) and the difference
(red symbols) as a function of the accumulated drawing strain φ.
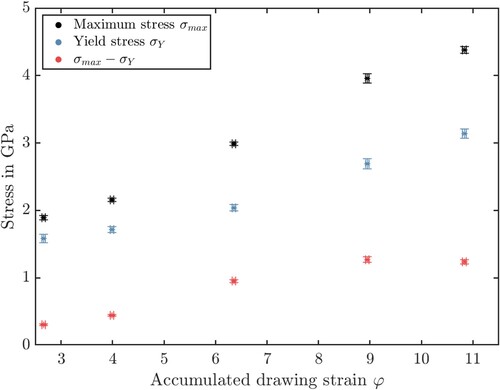
Table 3. Maximum stresses, yield stresses and the difference between both for the wires investigated in the course of this study.
Figure 5. Effective activation volume in
as a function of the relaxation stress
.
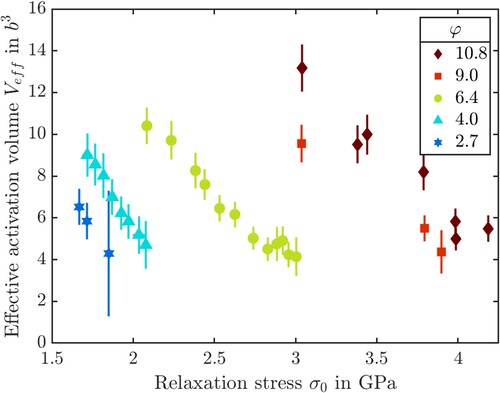
Figure 6. Strain-rate sensitivities from RSRE (filled symbols) and from SRJT (empty symbols) as a function of the relaxation and jump stress, respectively.
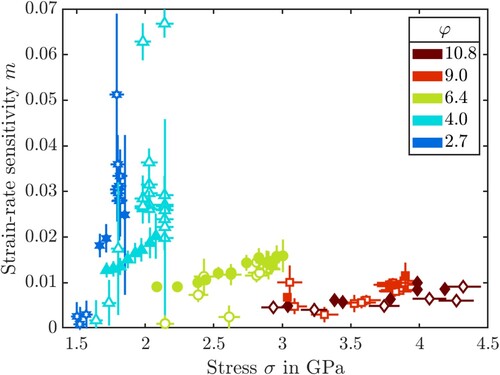
Table 4. Strain-rate sensitivities and activation volumes of different tungsten materials at room temperature.
Table 5. Activation volumes and strain-rate sensitivities of grain boundary sliding and the kink-pair mechanism.