
Figures & data
Table 1. Chemical composition of the Fe–3mass%Al alloy
Figure 1. Single-crystal specimen used in the present study obtained from a cast of an Fe–3mass%Al alloy with a coarse-grained microstructure: (a) shape, (b) orientation shown by stereographic projection (SGP) and (c) dimensions of the specimen. In (c), the unit is mm and t indicates the thickness.
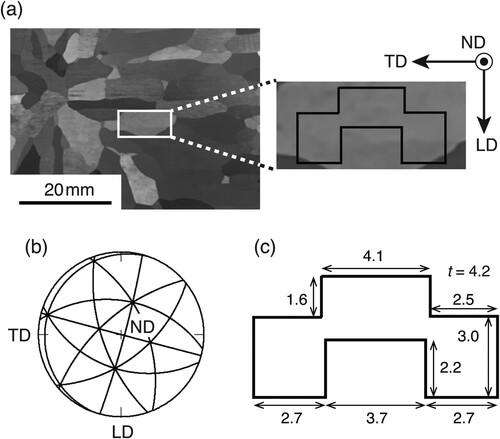
Figure 2. Schematic illustration showing the impact test setup.
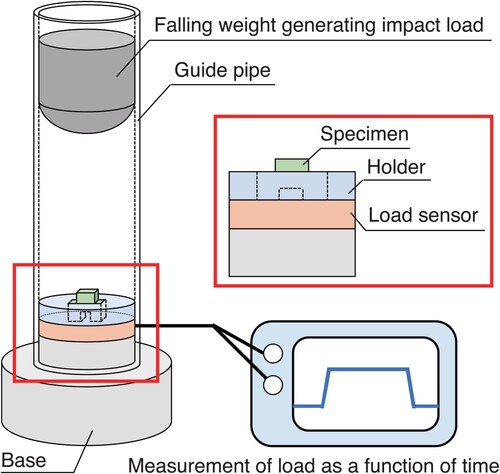
Figure 3. Deformation of the specimen caused by the impact test. Specimen shapes (a) before and (b) after the impact test. Polished surfaces of the (c) left and (d) right sides after the impact test. Cracks are visible in (c) and (d) along sheared zones. The white squares in (c) and (d) are the regions of SEM/EBSD measurements.
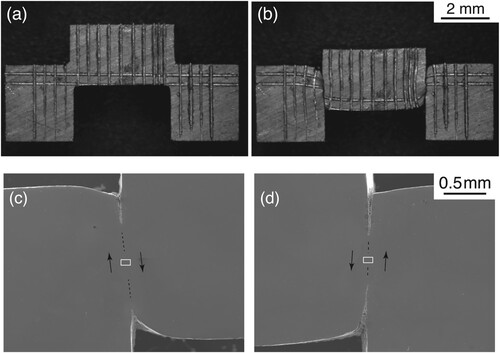
Figure 4. The variation of load as a function of time during the impact test. The load variation is divided into the three stages from I to III.
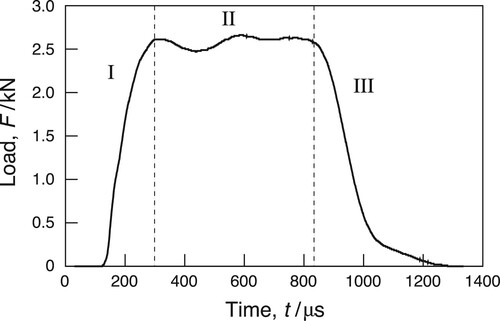
Figure 5. Microstructural changes in the right side resulting from the impact test. Inverse pole figure (IPF) maps for (a) the region within the white square shown in (d), (b) the enlarged region of a yellow square in (a), and (c) a pole figure for the macroscopic shear band shown in (a). The IPF maps show crystallographic orientations along LD using the colour code at the bottom.
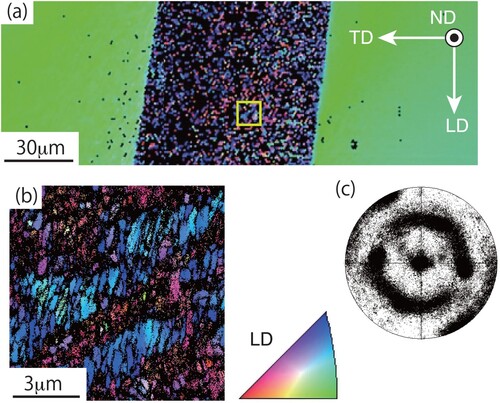
Figure 6. Microstructural changes in the left side resulting from the impact test. IPF maps for (a) the region within the white square shown in (c), (b) the enlarged region of a yellow square in (a) and (c) the further enlarged region of a yellow square in (b).
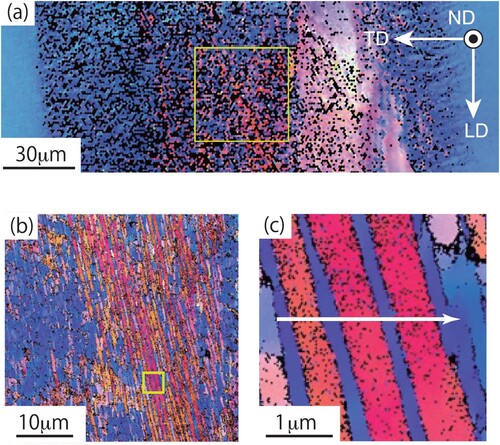
Figure 7. Graphical presentations of the orientation variations shown in (c). (a) Change in orientations as a function of position along a white arrow in (c) and (b) a pair of SGPs showing orientations at the positions of B and R in (a). In (b), a pair and a green solid line showing a trace of
are indicated in each SPG.
![Figure 7. Graphical presentations of the orientation variations shown in Figure 6(c). (a) Change in orientations as a function of position along a white arrow in Figure 6(c) and (b) a pair of SGPs showing orientations at the positions of B and R in (a). In (b), a [332]−[113¯] pair and a green solid line showing a trace of (332) are indicated in each SPG.](/cms/asset/3b987f91-f328-4dd6-add9-9cca2efbf01f/tphm_a_2243831_f0007_oc.jpg)
Figure 8. Arrays of atoms on the plane for the twinning mode of
and
in bcc materials. Open circles represent atoms above the plane, and filled circles represent atoms below the plane.
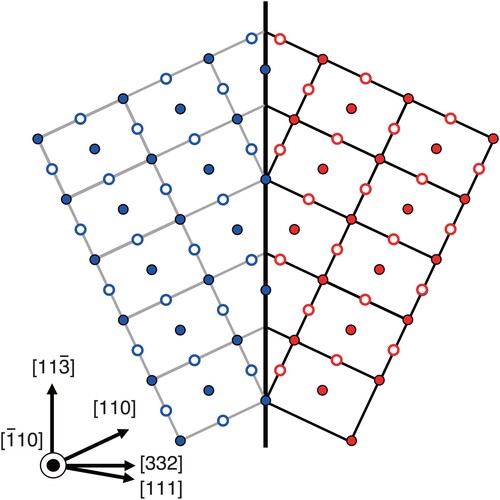
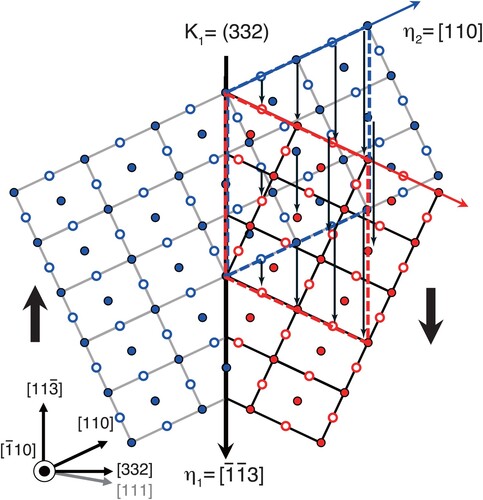
Figure 9. Motion of blue atoms to generate the twined crystal consisting of red atoms for the twinning with
. The thick black arrows represent the direction of the applied shear to induce this twinning. The thin black arrows indicate the atom motion of simple twinning shear and shuffling is necessary for the atoms without the arrows.
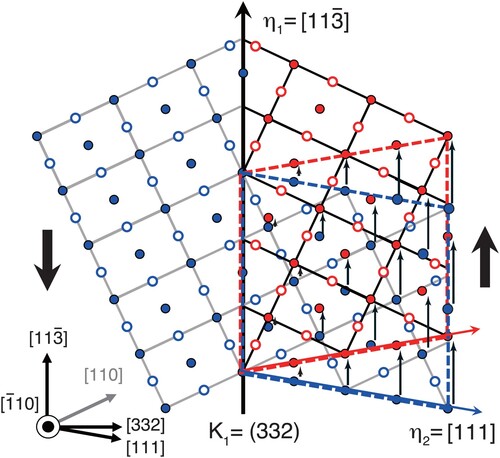
Figure 10. Motion of blue atoms to generate the twined crystal consisting of red atoms for the twinning with
. The thick black arrows represent the direction of the applied shear to induce this twinning. The thin black arrows indicate the atom motion of simple twinning shear and shuffling is necessary for the atoms without the arrows.
Data availability
The datasets used and/or analysed during the current study available from the corresponding author on reasonable request.