Figures & data
Figure 1. Schematic of the pyrolyzer design by Universidad Santo Tomás.
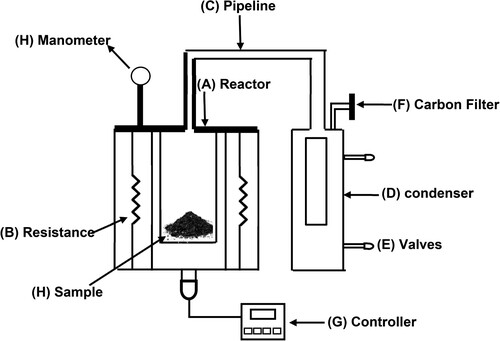
Table 1. Results of the elemental analysis and comparison on a dry basis with the reported values.
Table 2. Proximal analysis and comparison.
Figure 2. Thermogravimetric analysis (TGA) of spent coffee grounds at different heating rates.
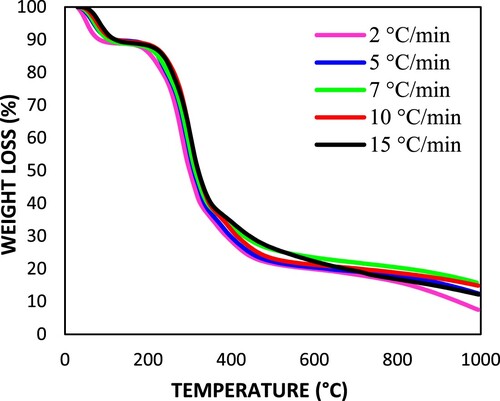
Figure 3. Differential thermogravimetric analysis (DTG) of spent coffee grounds at different heating rates.
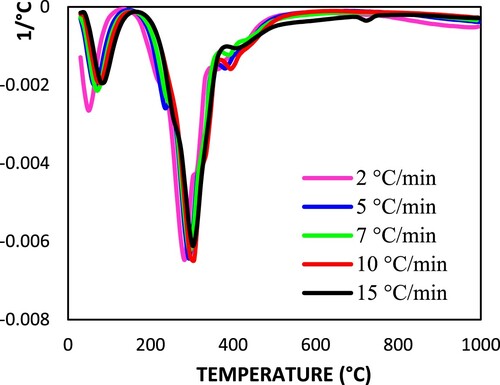
Figure 4. Application of the KAS method to obtain the activation energy Ea.
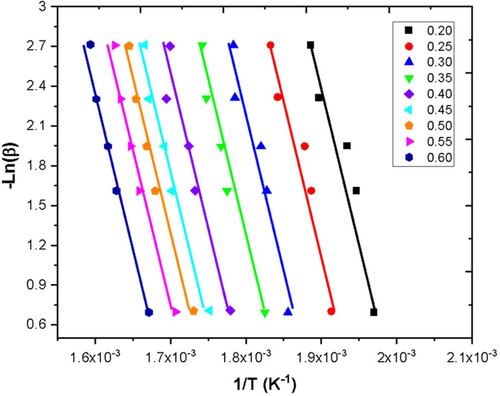
Figure 5. Application of the OFW method to obtain the activation energy Ea.
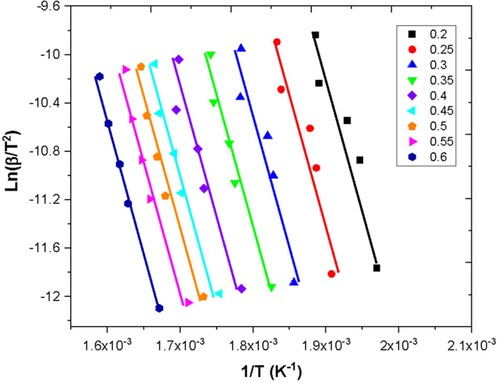
Figure 6. Activation energy vs. reaction progress α.
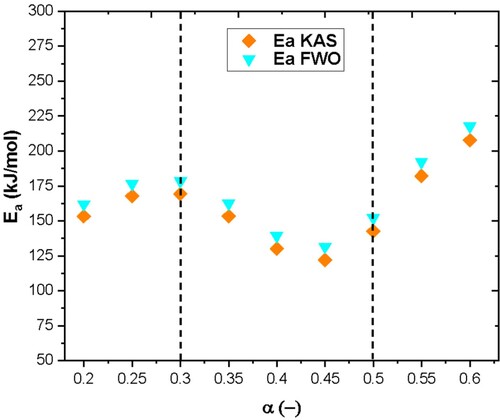
Figure 7. Conversion profiles of the thermal decomposition of SCGs as a function of temperature for five heating rates and the selected range of temperature for analysis.
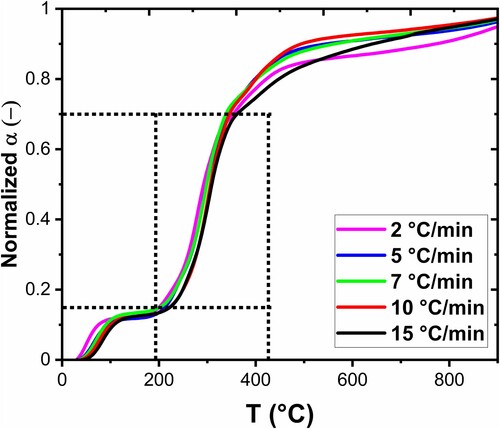
Figure 8. Normalized conversion profiles of the selected range of thermal decomposition of SCGs as a function of temperature for five heating rates.
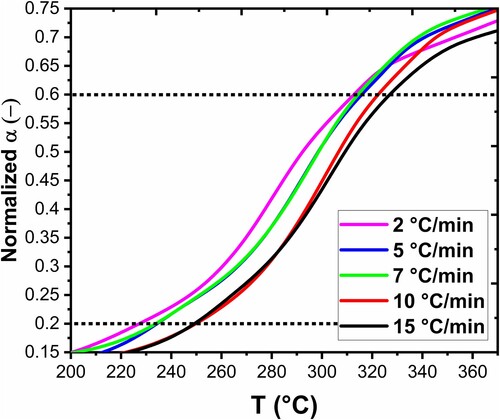
Table 3. Calculated E and A by the KAS and FWO methods
Table 4. Comparison of the activation energy between this work and other reports.
Table 5. Yield of pyrolysis tests (%).
Figure 9. Fourier transform infrared (FTIR) spectroscopy for spent coffee ground bio-oil. Source: Elaborated by the author.
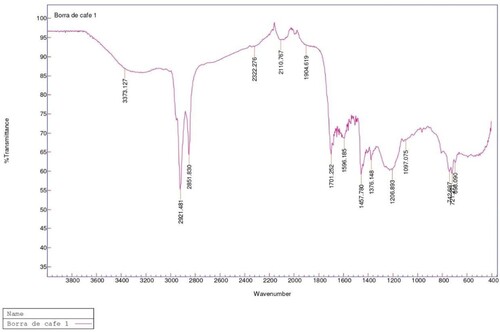
Figure 10. Test chromatogram 500 °C – 30 °C/min. Source: Elaborated by the author.
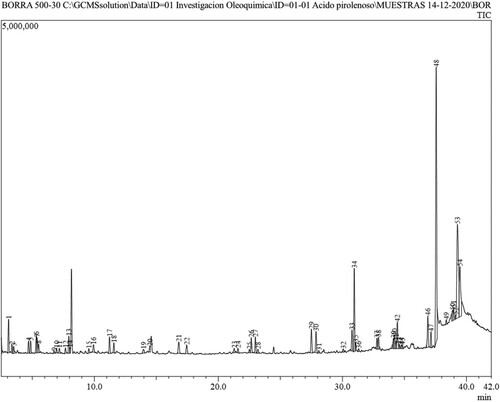
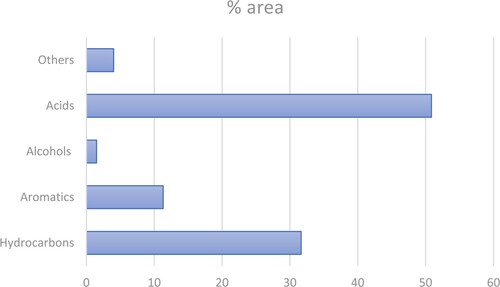
Figure 11. Families of bio-oil compounds from spent coffee grounds. Source: Elaborated by the author.