Figures & data
Table 1. List of properties for wicked problems (based on Rittel and Webber Citation1973).
Table 2. Overview of wickedness frameworks.
Table 3. Overview of selected operationalisation approaches for the wickedness concept.
Table 4. Generic differences (and similarities) between the four analysed case studies.
Figure 1. Historical greenhouse gas (GHG) emissions and reduction targets in CO2 equivalents in Germany, in total until 2050 (a) and disaggregated by sector until 2030 (b). Overall GHG reduction targets are relative to 1990 levels. Emissions from space heating and cooling are predominantly accounted for in the buildings sector (fuel combustion in residential and commercial buildings) but also occur in the energy supply sector (e.g. district heating, electrified heating and cooling). Source Bundes-Klimaschutzgesetz (KSG 2021).
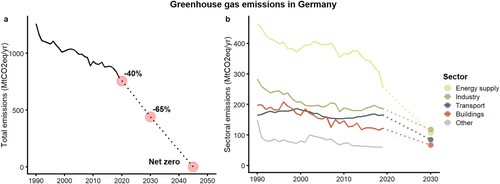
Table 5. Summary of case study introductions.
Table 6. Summary of case study analysis – examples for wickedness dimension #1 in the four cases, incl. supporting arguments (TD: technical domain; GD: governance domain).
Table 7. Summary of case study analysis – examples for wickedness dimension #2 in the four cases, incl. supporting arguments (TD: technical domain; GD: governance domain).
Table 8. Summary of case study analysis – examples for wickedness dimension #3 in the four cases, incl. supporting arguments (TD: technical domain; GD: governance domain).
Table 9. Summary of case study analysis – examples for wickedness dimension #4 in the four cases, incl. supporting arguments (TD: technical domain; GD: governance domain).
Table 10. Summary of case study analysis – examples for wickedness dimension #5 in the four cases, incl. supporting arguments (TD: technical domain; GD: governance domain).
Table 11. Summary of case study analysis – examples for wickedness dimension #6 in the four cases, incl. supporting arguments (TD: technical domain; GD: governance domain).
Table 12. Summary of case study analysis – examples for wickedness dimension #7 in the four cases, incl. supporting arguments (TD: technical domain; GD: governance domain).
Table 13. Summary of case study analysis – examples for wickedness dimension #8 in the four cases, incl. supporting arguments (TD: technical domain; GD: governance domain).
Table 14. Summary of case study analysis – examples for wickedness dimension #9 in the four cases, incl. supporting arguments (TD: technical domain; GD: governance domain).
Table 15. Summary of case study analysis – examples for wickedness dimension #10 in the four cases, incl. supporting arguments (TD: technical domain; GD: governance domain).
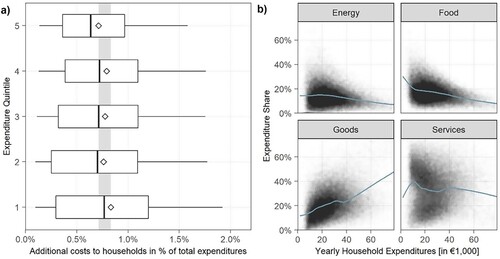
Figure 2. Panel a) shows first-order additional costs of transport fuel carbon pricing (35 EUR/tCO2) among German households. Y-axis shows expenditure quintiles. Expenditure quintile 1 comprises the 20% of German households with the lowest per capita expenditures. Expenditure quintile 5 comprises the 20% of German households with the highest per capita expenditures. The X-axis displays additional costs in per cent of total consumption expenditures. Whiskers represent within-quintile 5th to 95th percentiles. The rhombi represent the mean. The Grey vertical bar represents the difference between first and fifth quintiles’ average additional costs. Panel c) shows household-level expenditure shares for energy, food, goods and services over total household expenditures in Germany. The blue line indicates a polynomially fitted regression line.