
Figures & data
Figure 1. Flow chart of the entire simulation process. Modified from Ju et al. (Citation2021).
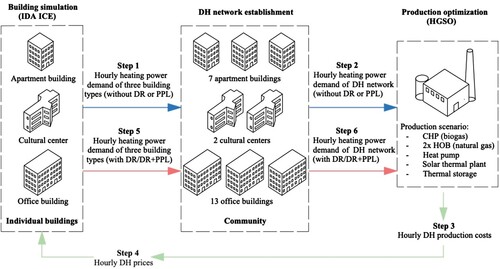
Figure 2. Building simulation process flow chart.
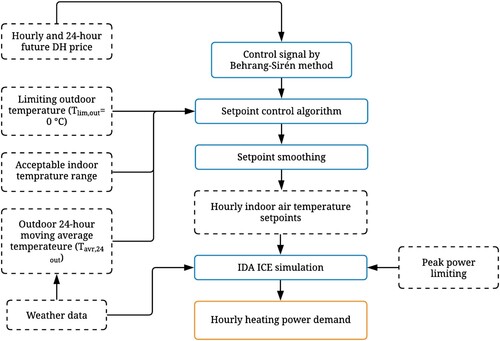
Figure 3. Measured outdoor temperature in Hamburg in 2018.
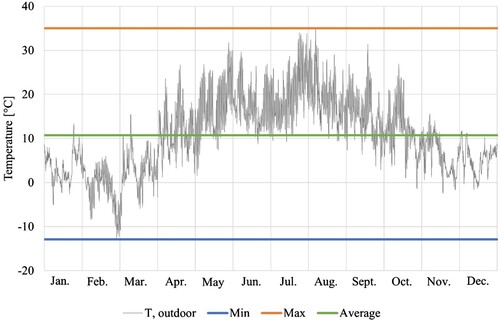
Table 1. General building information.
Table 2. Building model parameters used in the IDA ICE simulations.
Figure 4. Heating inlet water temperatures used in the building simulations.
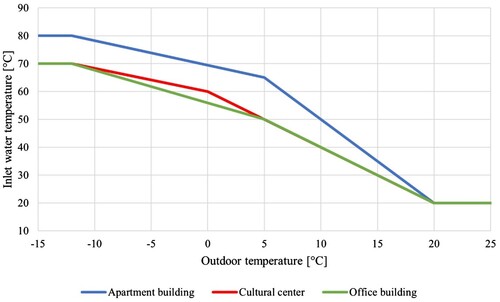
Table 3. Ventilation systems’ input parameters.
Figure 5. Indoor air temperature setpoint control algorithm flow chart.
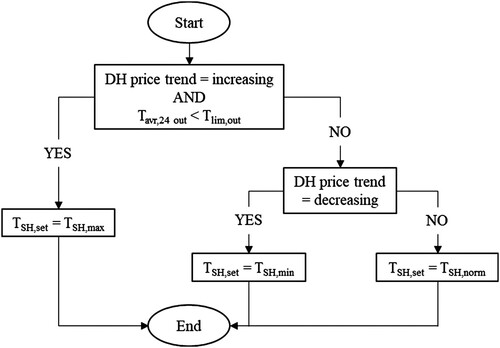
Table 4. Generation units and their powers in the used production scenario.
Figure 6. District heating supply temperature and the optimal maximum return temperature of the district heating network of Hamburg.
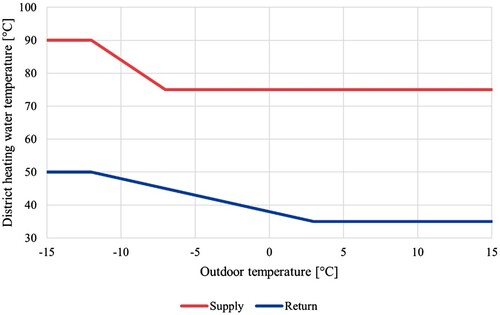
Table 5. Price structure of the distritct heat.
Table 6. Main parameters of the dynamic DH consumer price of the studied production scenario.
Table 7. Building simulation cases.
Table 8. District heating network level simulation combinations. Quantity of each building type, demand response and peak power limiting setup.
Figure 7. Duration curves of the space heating power in apartment building cases in the heating season.
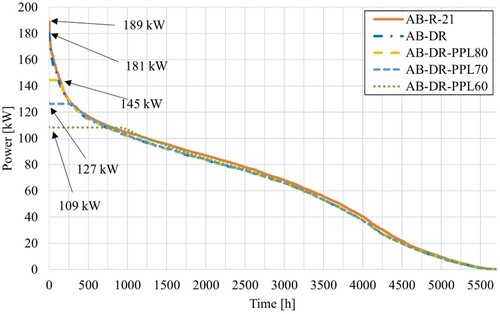
Figure 8. Hourly space heating demand in apartment building on one of the coldest days of the simulation year.
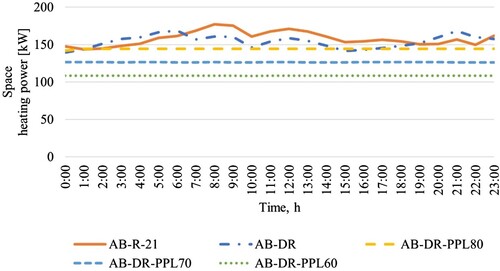
Table 9. Annual power and energy results of the apartment building cases. Power limit time indicates the occupied hours that the peak limit takes place, and the time percentage indicates the share of the occupied hours.
Figure 9. Duration curves of the space and ventilation heating power of occupied hours in the cultural centre case in the heating season.
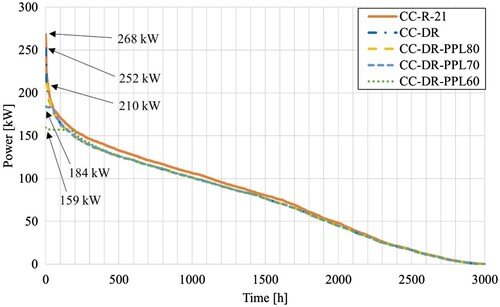
Figure 10. Hourly space and ventilation heating demand in cultural centre on one of the coldest days of the simulation year.
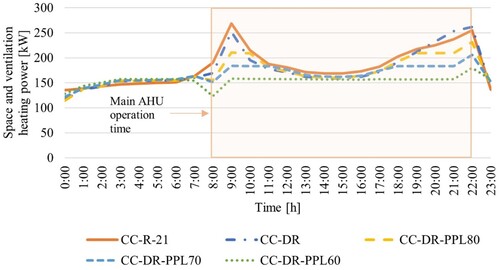
Table 10. Annual power and energy results of the cultural centre cases. Power limit time indicates the occupied hours that the peak limit takes place, and the time percentage indicates the share of the occupied hours.
Figure 11. Duration curves of the space and ventilation heating power of occupied hours in the office building cases in the heating season.
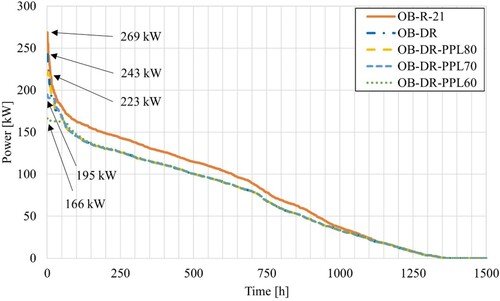
Table 11. Annual power and energy results of the office building cases. Power limit time indicates the occupied hours that the peak limit takes place, and the time percentage indicates the share of the occupied hours.
Figure 12. Hourly space and ventilation heating demand in office building on one of the coldest days of the simulation year.
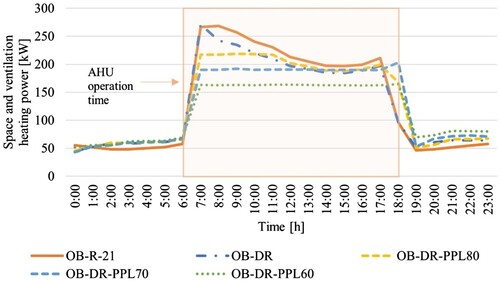
Figure 13. Hourly indoor air temperature in office building simulation in one of the coldest days of the year.
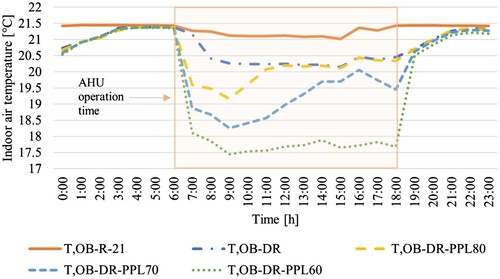
Table 12. Annual district heating energy, base and total DH cost savings in apartment building cases.
Table 13. Annual district heating energy, base and total DH cost savings in cultural centre cases.
Table 14. Annual district heating energy, base and total DH cost savings in office building cases.
Table 15. Indoor air setpoint variation in hours
Table 16. The effect of demand response and peak power limiting to indoor air temperature in the coldest occupied room in the apartment building simulation.
Figure 14. Duration curves of the indoor air temperature in the coldest occupied room during the coldest 800 h in the apartment simulation cases.
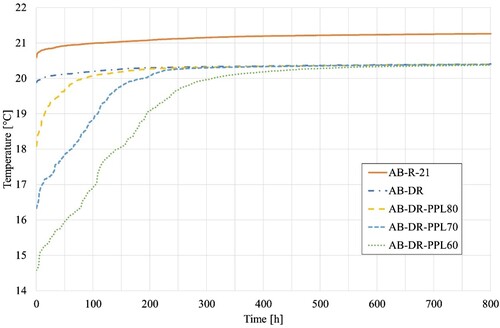
Table 17. The effect of demand response and peak power limiting to indoor air temperature in the coldest occupied room in the cultural centre simulation.
Figure 15. Duration curves of the indoor air temperature in the coldest occupied room during the coldest 100 h in the cultural centre simulation cases.
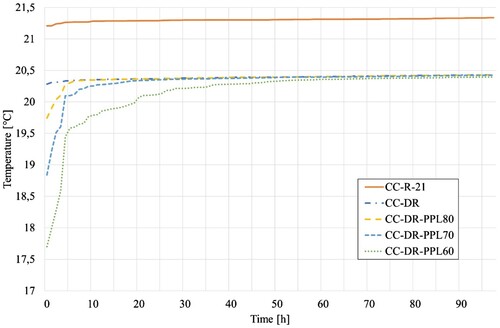
Table 18. The effect of demand response and peak power limiting to indoor air temperature in the coldest room of the office building simulation.
Figure 16. Duration curves of the indoor air temperature in the coldest occupied room during the coldest 100 h in the office building simulation cases.
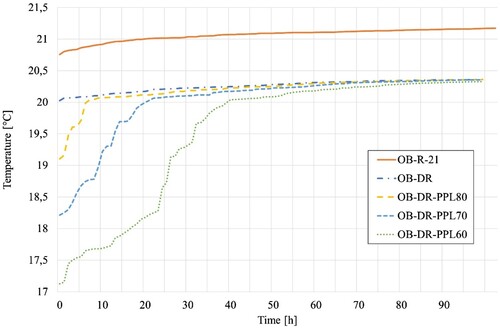
Figure 17. Annual hourly community district heating power demand of the simulated year.
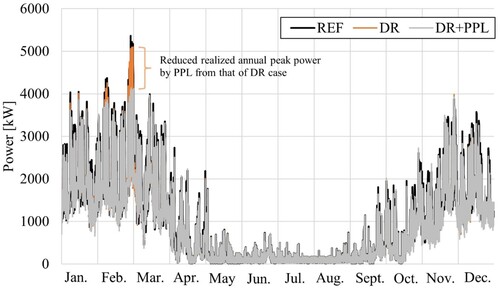
Figure 18. Duration curve of the district heating system’s total power demand of the highest demand hours. The effect of the peak power limiting is illustrated by hatched area.
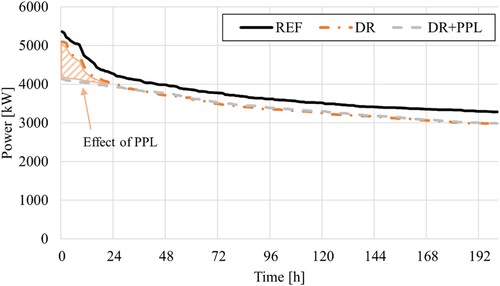
Table 19. Network level demand response and peak power limiting results. Difference is stated relative to the reference case for DR and DR&PPL cases separately.