Figures & data
Figure 1. Monthly ESBL-producing K. pneumoniae incidence versus use of third-generation cephalosporin (5-month moving averages).
Figure 2. Monthly ESBL-producing K. pneumoniae incidence versus use of alcohol-based hand rub (5-month moving averages).
Table 1. Linear regression modeling results for ESBL-producing Klebsiella pneumoniae, January 2017 to December 2021; adjusted R-squared = 20.03%.
Table 2. MARS (Additive) result in modeling ESBL-producing Klebsiella pneumoniae incidence, January 2017 to December 2021; adjusted R-squared = 22.47%.
Table 3. MARS (Interaction, i = 2) result in modeling ESBL-producing Klebsiella pneumoniae incidence, January 2017 to December 2021; adjusted R-squared = 29.77%.
Table 4. Absolute and relative change in determined Adjusted R-squared for the identified models.
Figure 3. a) Alcohol-based hand rub chart showing the statistical significance (t-values) of the estimated coefficients related to the threshold values from the OAT sensitivity analysis. The solid black vertical lines mark an identified threshold. b) Third-generation cephalosporin chart showing the statistical significance (t-values) of the estimated coefficients related to the threshold values from the OAT sensitivity analysis. The solid black vertical lines mark an identified threshold.
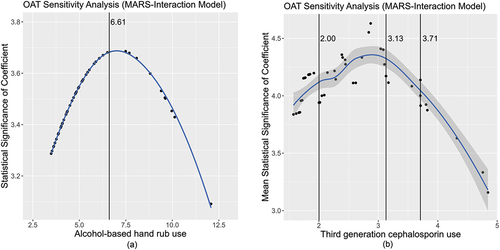
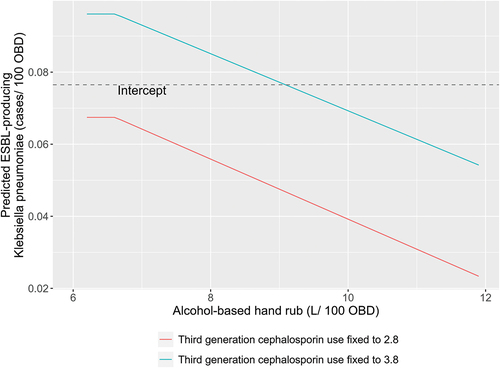
Figure 4. Contribution chart for the effect of alcohol-based hand rub (ABHR) on the incidence rate of ESBL-producing K. pneumoniae holding third-generation cephalosporin use at constant levels..