Figures & data
Figure 1. Distribution of different cancer types in this study
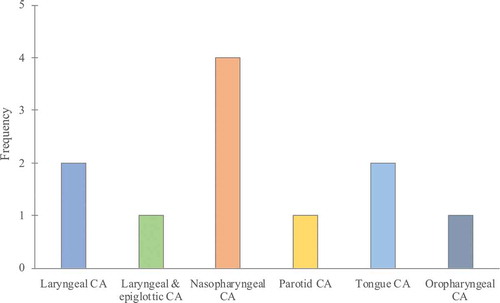
Table 1. Patient characteristics (n = 11)
Table 2. Periodontal parameters when all teeth, maxilla, and mandible were examined pre- and post-radiotherapy (1 month after the radiotherapy). The significance between these two time-points calculated by paired t-test for each parameter
Figure 2. Mean levels of aMMP-8 (ng/ml) with 95% confidence interval bars for time-points of pre-radiotherapy, at the end of 6 weeks of radiotherapy and one month after radiotherapy. All significant (* p < 0.05) pairwise comparisons from repeated measures ANOVA analysis adjusted for multiple comparisons (the Bonferroni post hoc test) are marked in the figure
Figure 3. Mean levels of IL-6 (pg/ml) with 95% confidence interval bars for time-points of pre-radiotherapy, at the end of 6 weeks of radiotherapy and one month after radiotherapy. No significant pairwise comparisons were found from repeated measures ANOVA analysis adjusted for multiple comparisons (the Bonferroni post hoc test)
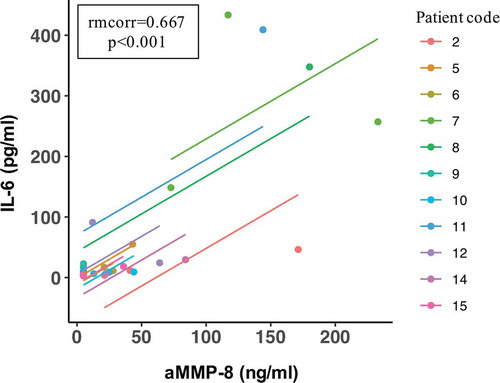
Figure 4. Repeated measures correlation (rmcorr) plot for aMMP-8 and IL-6 levels in mouthrinse that were measured pre-radiotherapy, at the end of 6 weeks of radiotherapy and one month after the end of radiotherapy for eleven head and neck cancer patients