Figures & data
Table 1. Extract of the EDSM analytic scheme: specialisation and objectification.
Figure 1. Coding tree for specialisation.
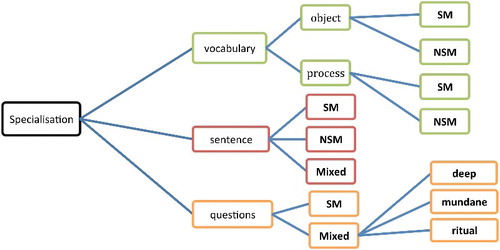
Figure 2. Proportions of specialised school mathematics and non-specialised objects and processes: (a) Proportions of object words specialised to school mathematics and non-specialised objects; (b) Proportions of process words specialised to school mathematics and non-specialised processes.
Table 2. Proportions of specialised vocabulary – objects and processes.
Table 3. Specialised objects – symbolic and verbal.
Table 4. Frequency of the most common school mathematics processes found in 1980, 1991 and 2011.
Figure 3. Edexcel GCSE Mathematics (Linear) – 1380, June 2011, Paper 4 Higher Tier, question 1.
Figure 4. Variation in instructions to students to calculate, find or work out.
Figure 5. Implicit expectation of algebraic manipulation. University of London GCE Ordinary Level Mathematics Syllabus B Paper 2, June 1980.
Table 5. Occurrence of prove and show that/show how.
Figure 6. Degree of contextualisation (all questions).
Figure 7. Degree of contextualisation (contextualised questions only).
Figure 8. Specialised reified objects.
Figure 9. Density of specialised reified objects per question.
Figure 10. University of London, GCE Examination Ordinary Level, Mathematics Syllabus B (361), Paper 2, June 1980.
Figure 11. OCR GCSE Mathematics Syllabus A, Paper 4 (Higher Tier), June 2011.