Figures & data
Table 1. Exposition topics ordered by unit within chapters.
Figure 1. An exposition with a diagram in the main text (Jefferson et al., Citation2017, p. 106).
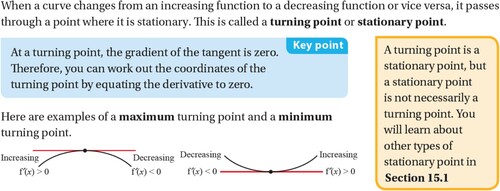
Figure 2. An exposition with diagrams in the margin (Jefferson et al., Citation2017, p. 16).
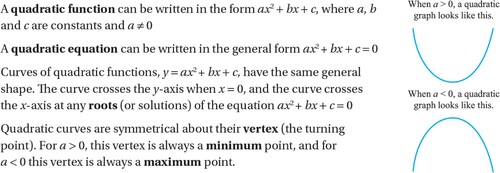
Table 2. Number of judges and judgements per group.
Table 3. Reliability measures for each group.
Figure 3. Correlations between exposition scores generated via comparative judgement by students, teachers and undergraduates.
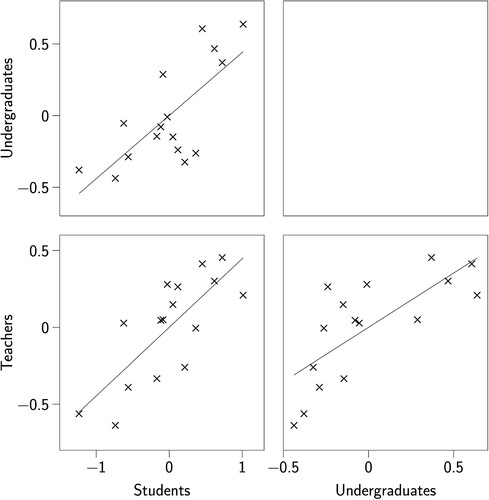
Figure 4. Mean perceived exposition quality scores for expositions with diagrams in the text and in the margins.
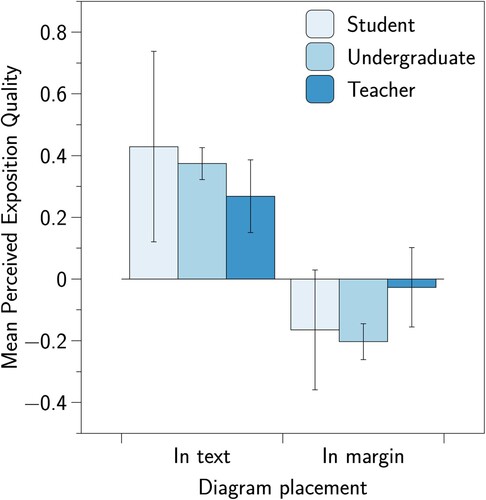
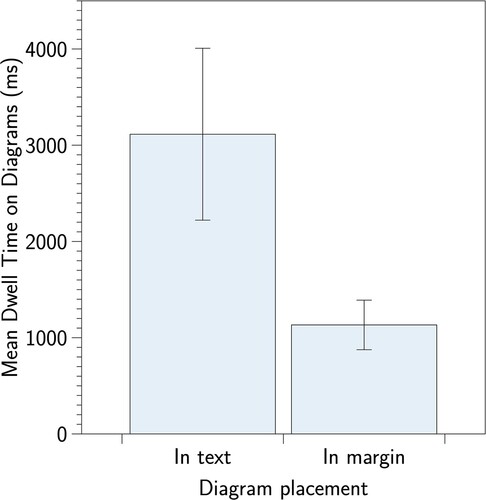
Figure 5. The mean dwell time spent on diagrams in the text and in the margin; error bars show standard error of the mean.