
Figures & data
Table 1. Summary test descriptions and measurement objectives for all tests variables.
Table 2. Summary of means and SDs for all the main dependent variables used in the factor analyses.
Figure 1. Hearing thresholds, means and SDs for the entire frequency range measured for the 200 hearing-impaired participants.
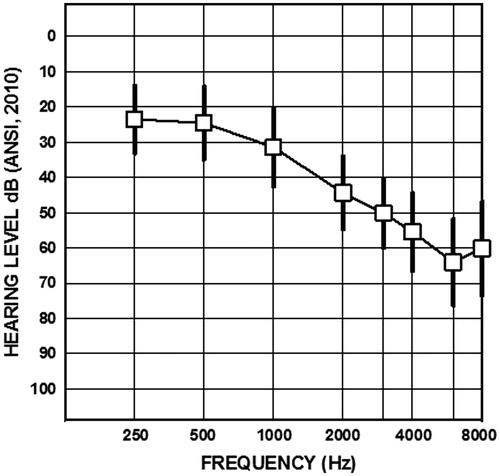
Figure 2. Insertion gain response curves for the linear amplifications (upper panel) and amplification with fast-acting compression (lower panel). Curves in solid lines represent insertion gain based on the average hearing thresholds at 125 through 8000 Hz. Curves in dotted lines represent insertion gain response based on hearing thresholds one standard deviation above/below average.
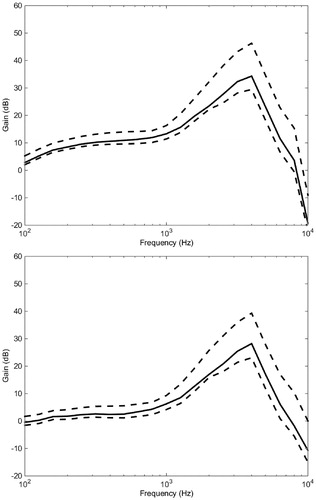
Figure 3. Overview of the exploratory factor analyses.
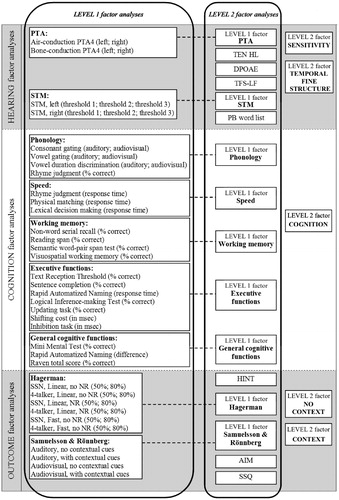
Table 3. Summary of all factor analyses.
Table 4. Summary of LEVEL 2 Factor analyses. The scale has been reversed for some variables (marked with *) such that higher values on all variables represent better HEARING, COGNITION, and speech in noise OUTCOME abilities. This was done to make the interpretations of the factors easier.
Table 5. Correlations among the LEVEL 2 components.
Table 6. Correlations among the LEVEL 2 components, with age partialled out.