Figures & data
Figure 1. Audiometric thresholds for NH and HFHL subjects (for test ear). Error bars represent SDs.
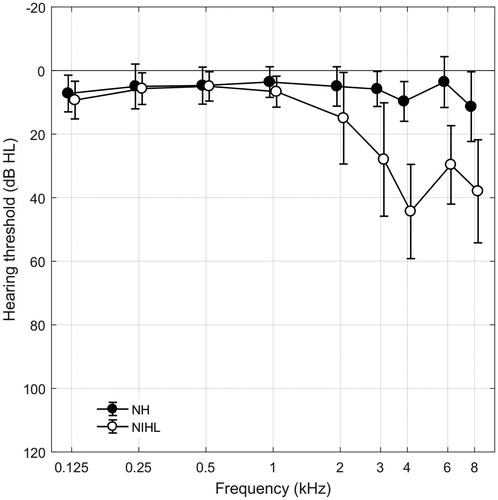
Table 1. Participant characteristics.
Table 2. Characteristics of the test noises.
Figure 2. Participant flowchart.
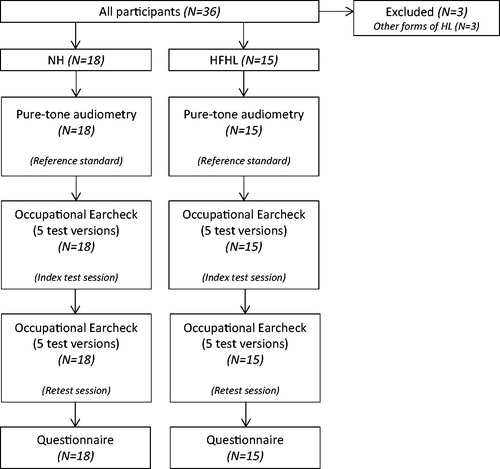
Figure 3. Mean SRT in dB SNR, for NH and HFHL subjects, for all test versions (OEC test). Error bars represent 95% confidence intervals.
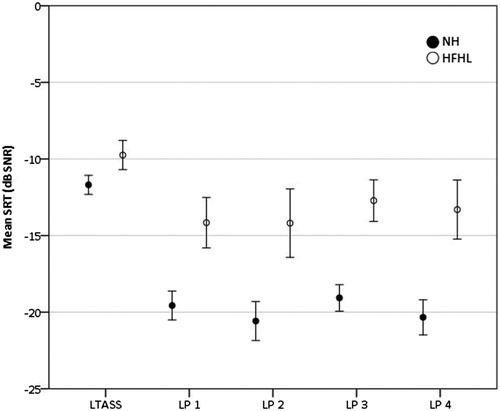
Table 3. Mean differences in SRT (dB SNR) (SD) for NH and HFHL subjects.
Table 4. ROC area, sensitivity and specificity, and cut-off value for pass/fail, for all test versions.
Figure 4. Scatterplots of SRT values against PTA3,4,6 (upper figure), and test against retest results (lower figure), for test version LP 3, for NH and HFHL subjects.
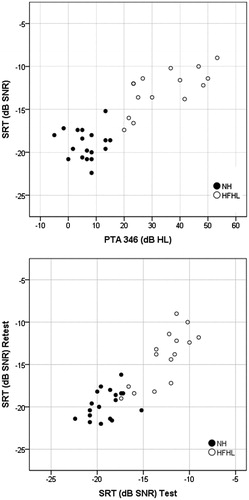
Table 5. Bivariate correlation coefficients (Pearson’s r) of the SRT values against the PTA of the frequencies 0.5, 1, 2, 4 kHz (PTA0.5,1,2,4) and 3, 4, 6 kHz (PTA3,4,6) for all test versions (OEC test).
Table 6. Test–retest characteristics of NH and HFHL subjects.
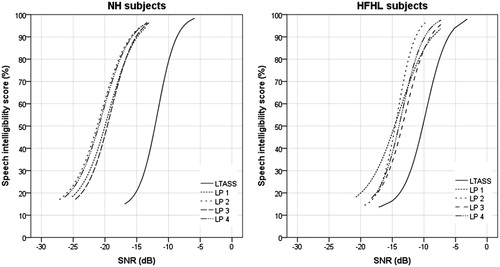
Figure 5. Psychometric functions for NH subjects (N = 18) (left), and for HFHL subjects (N = 15) (right), per test version.